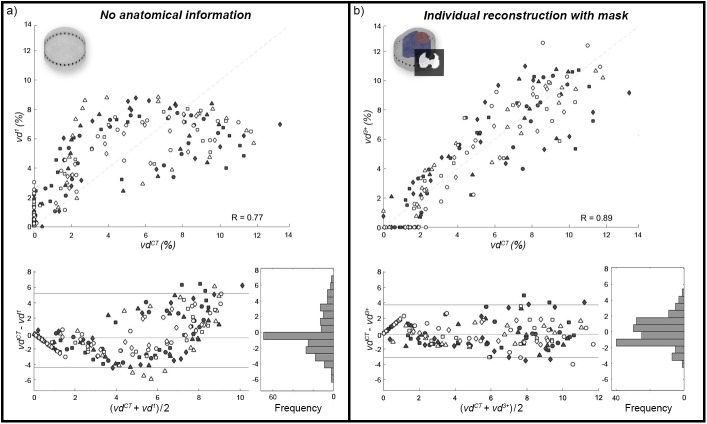
Fig 5. Regional ventilation in 4DCT and EIT.
Comparison of regional ventilation acquired from 4DCT and EIT. a) Calculations based on the circular model M1 without anatomical information and (b) on M3 with individual boundaries and lung mask. For both, pooled Pearson correlation, Bland-Altman and distribution of differences are shown. Different symbols correspond to values from different animals (n = 8), whereby only values of vd greater than zero in at least one of the two compared methods are considered. Since the differences of both methods are not normally distributed, bias and limits of agreement are represented as median and 95% quantile interval, respectively.

