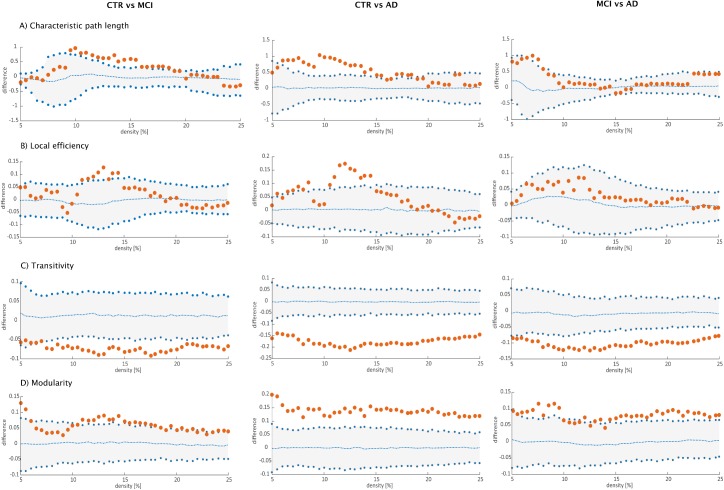
Fig 5. Differences between groups in global structural topology.
Left: differences between controls (CTR) and Alzheimer’s disease (AD) patients; middle: differences between controls (CTR) and patients with mild cognitive impairment (MCI); right: differences between patients with mild cognitive impairment (MCI) and Alzheimer’s disease (AD) patients for A) characteristic path length, B) local efficiency, C) transitivity and D) modularity. The plots show the lower and upper bounds (blue circles) of the 95% Confidence Intervals (CI) (gray shade) as a function of density. The orange circles show the differences between groups and, when falling outside the CI, indicate that the difference was statistically significant at p<0.05. The blue dots in the middle with values around zero indicate the mean values of the difference in global network measures between the randomized groups after permutation tests.

