
Figure 5.
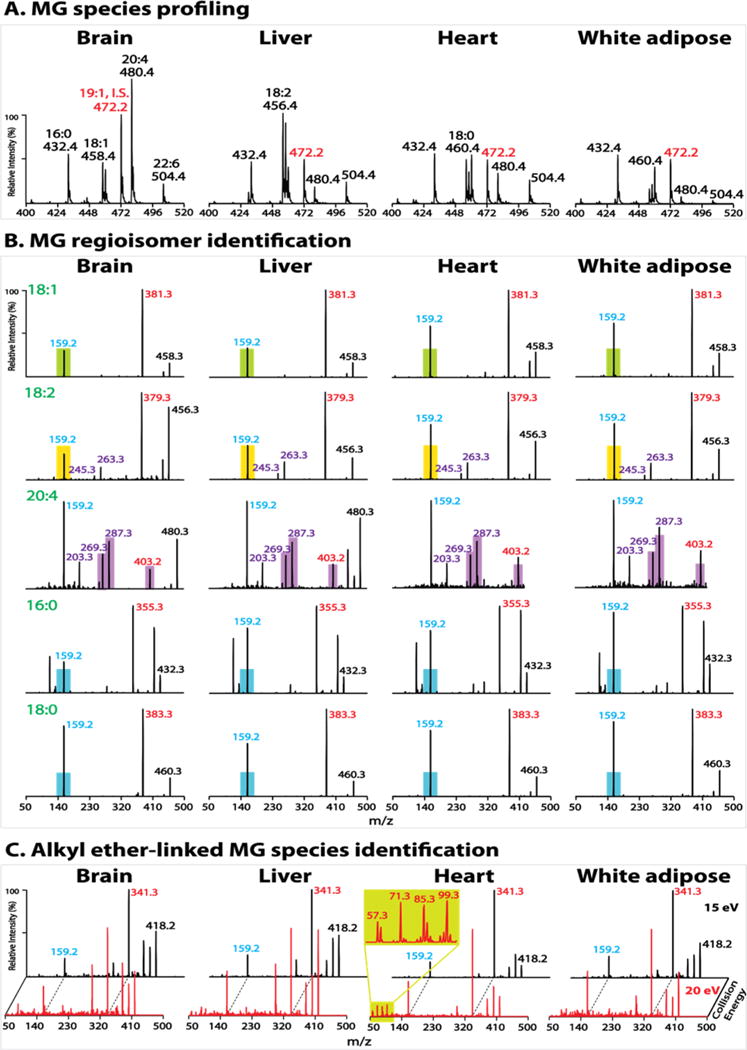
Tissue monoglyceride (MG) profiling and molecular species identification. Lipid extracts of mouse brain, liver, heart and white adipose tissues were prepared by a single-phase MTBE extraction without acid followed by acetonitrile enrichment, as described in Experimental Section. (A) Representative spectra of precursor ion scanning (PIS) of m/z 159 after normalization to the internal standard (I.S.) peak at m/z 472 (1–19:1 MG). Note that the amount of I.S. for brain tissue (20 pmol/mg tissue) is twice that in other tissues. (B) Product ion spectra of representative MG molecular species. The filled color bars (except purple bars) indicate the peak height of m/z 159 of the authentic sn-2 isomer (e.g., green bar for 2-OG, yellow bar for 2-LG, and blue bar for 2-PG and 2-18:0 MG). The m/z 159 peak height of an endogenous MG species close to or below the bar indicates its sn-2 identity while above the bar identifies the coexistence of sn-1 and sn-2 isomers whose composition can be quantified as described in the text. The filled purple bars indicate the peak heights of the two ketene fragment ions (m/z 287 and m/z 269), and of m/z 403 (from neutral loss of 77 amu) for authentic 2-AG. The peak heights of these fragment ions of an endogenous AG species close to or above the bars indicate its sn-2 identity while below the bars identify the coexistence of 1- and 2-AG which were not observed in the examined tissues. (C) Product ion spectra of molecular ion m/z 418 acquired at collision energies of 15 and 20 eV. The enlarged low mass range spectrum from heart extract demonstrates the fingerprint pattern for alkyl ether-linked species (i.e., 1-a16:0 MG).