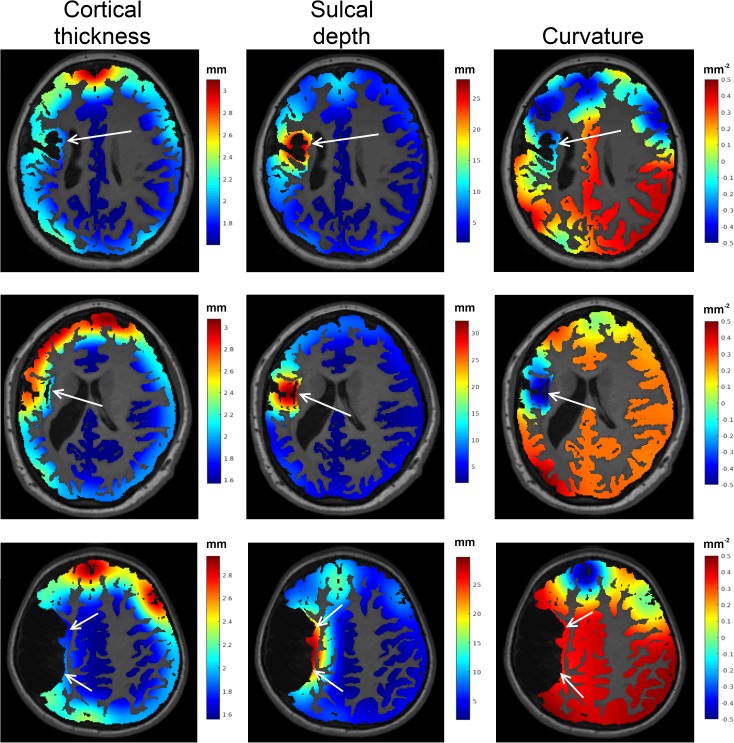
Fig 3. An illustration of three cortical abnormalities.
The first column shows the measured cortical thickness (in mm), the second columns shows sulcal depth (in mm) and the third column shows the curvature (in mm-2) of these cortices. Regions of injury were observed to have higher sulcal depths, and reduced cortical thickness and curvature.

