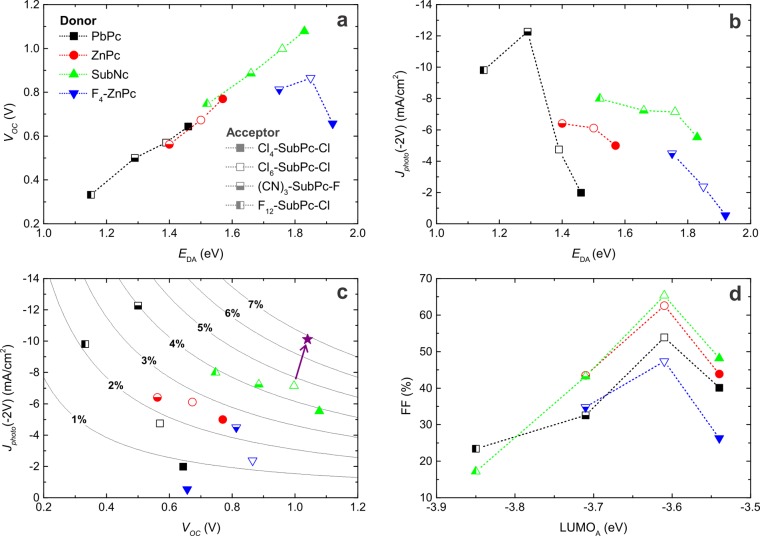
Figure 2.
Relation of OPV performance parameters to the heterojunction energetics. (a) VOC scales linearly with the interface band gap energy EDA. (b) The photocurrent at reverse bias generally decreases with EDA. (c) The trade-off between photocurrent and VOC limits the PCE of organic heterojunction devices. The contour lines represent PCEs calculated assuming a 65% FF and a voltage-independent photocurrent. The arrow indicates a device with an exciton-blocking hole transport layer, which increases the photocurrent and consequently the PCE. (d) The FF is related to the LUMO energy of the acceptor.

