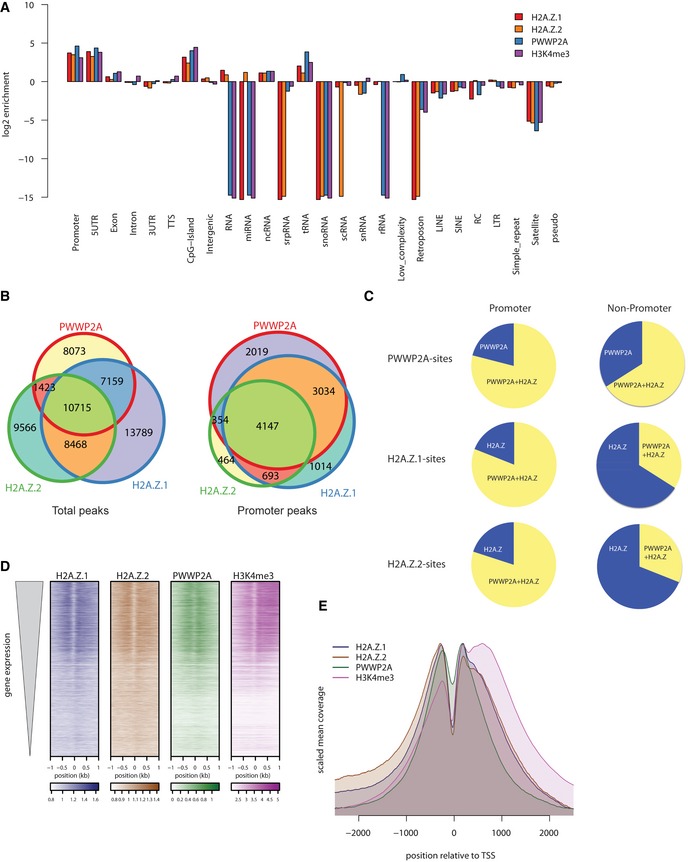
Figure 4. PWWP2A binds H2A.Z nucleosomes at TSS of actively transcribed genes.

- Log2‐enrichment plot representing genomic regions after GFP‐PWWP2A (blue), GFP‐H2A.Z.1 (red), GFP‐H2A.Z.2 (orange), and H3K4me3 (purple) nChIP‐seq. Shown are two biological replicates for each nChIP. See also Fig EV2A for representative genome browser captures.
- Venn diagrams displaying total (left) or promoter‐occupying (right) peaks of HeLaK GFP‐PWWP2A, GFP‐H2A.Z.1, and GFP‐H2A.Z.2. Promoters are defined as −3 kb < TSS < +1 kb.
- Distribution of overlapping peaks between GFP‐PWWP2A (top), GFP‐H2A.Z.1 (middle), and GFP‐H2A.Z.2 (bottom) nChIP‐seq data of promoter (left) and non‐promoter (right) regions according to (B).
- Heatmap of nChIP‐seq peaks at transcriptional start sites (TSS) sorted for expression level (top: high expressed, bottom: low expressed genes).
- Correlation of GFP‐PWWP2A (green), ‐H2A.Z.1 (blue), ‐H2A.Z.2 (brown), and H3K4me3 (purple) mean coverage signals at TSS of expressed genes. See Fig EV2B for GFP‐PWWP2A localization at euchromatic regions.
