
Figure 7. PWWP2A does not influence H2A.Z occupancy but C‐terminal tail of H2A.Z mediates PWWP2A nucleosome binding.
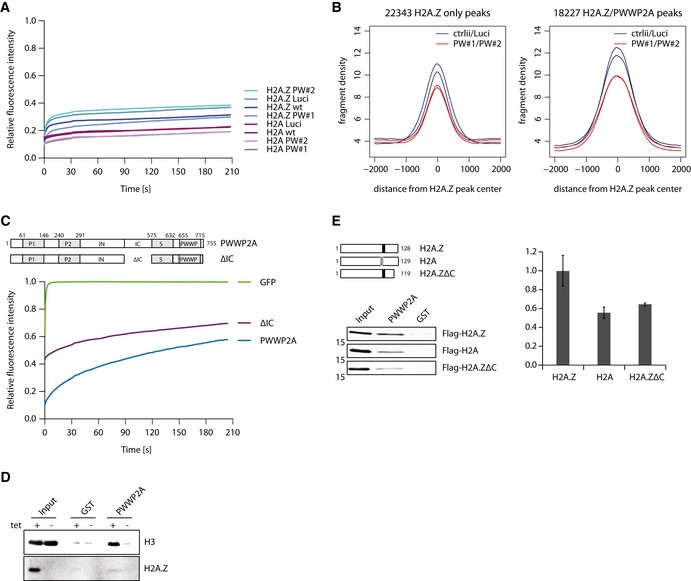
- FRAP quantification curves of average GFP signal relative to fluorescence signal prior to bleaching from HeLaK stably expressing GFP‐H2A or GFP‐H2A.Z.1 2 days after control (wt, Luci) or PWWP2A (PW#1, PW#2) knockdown (n = 9–19) (see Appendix Fig S4A for FRAP experiments).
- Venn diagram displaying sole GFP‐H2A.Z.1 (left, 22,343 peaks) or overlapping with PWWP2A (left, 18,227 peaks) nChIP‐seq signals in control (ctrlii, Luci; dark blue) or PWWP2A‐depleted (PW#1, PW#2; red) background (see also Fig EV4A and B).
- Schematic representation of PWWP2A and IC region deletion (ΔIC) (top). FRAP quantification curves (bottom) as shown and described in Fig 3C with the addition of GFP‐ΔIC (n = 16) (see also Appendix Fig S4C for FRAP IF pictures).
- Immunoblotting of endogenous H3 and H2A.Z (verification of tetracycline (tet)‐induced knockout efficiency) upon IP of mononucleosomes derived from WT or H2A.Z DKO DT40 cells with recombinant GST (negative control) or GST‐PWWP2A. Notice that less H3 is pulled down with PWWP2A when H2A.Z is depleted.
- Schematic representation of Flag‐tagged chicken H2A, H2A.Z, and H2A.Z C‐terminal deletion mutant (H2A.ZΔC) (top, left). Note indication of acidic patch in H2A (gray box) and extended acidic patch in H2A.Z (black box). After transient transfection of HK cells with Flag‐constructs, derived mononucleosomes were incubated with recombinant GST or GST‐PWWP2A and binding efficiency and variant‐specificity was tested in immunoblots with anti‐Flag antibody (left). Right: Quantification of signal intensities of immunoblots using Image Studio Lite Ver 5.2 (LI‐COR). Error bars indicate SEM of four independent replicates. See Fig EV4E for partial growth rescue of Flag‐H2A.ZΔC in DKO cells.
Source data are available online for this figure.