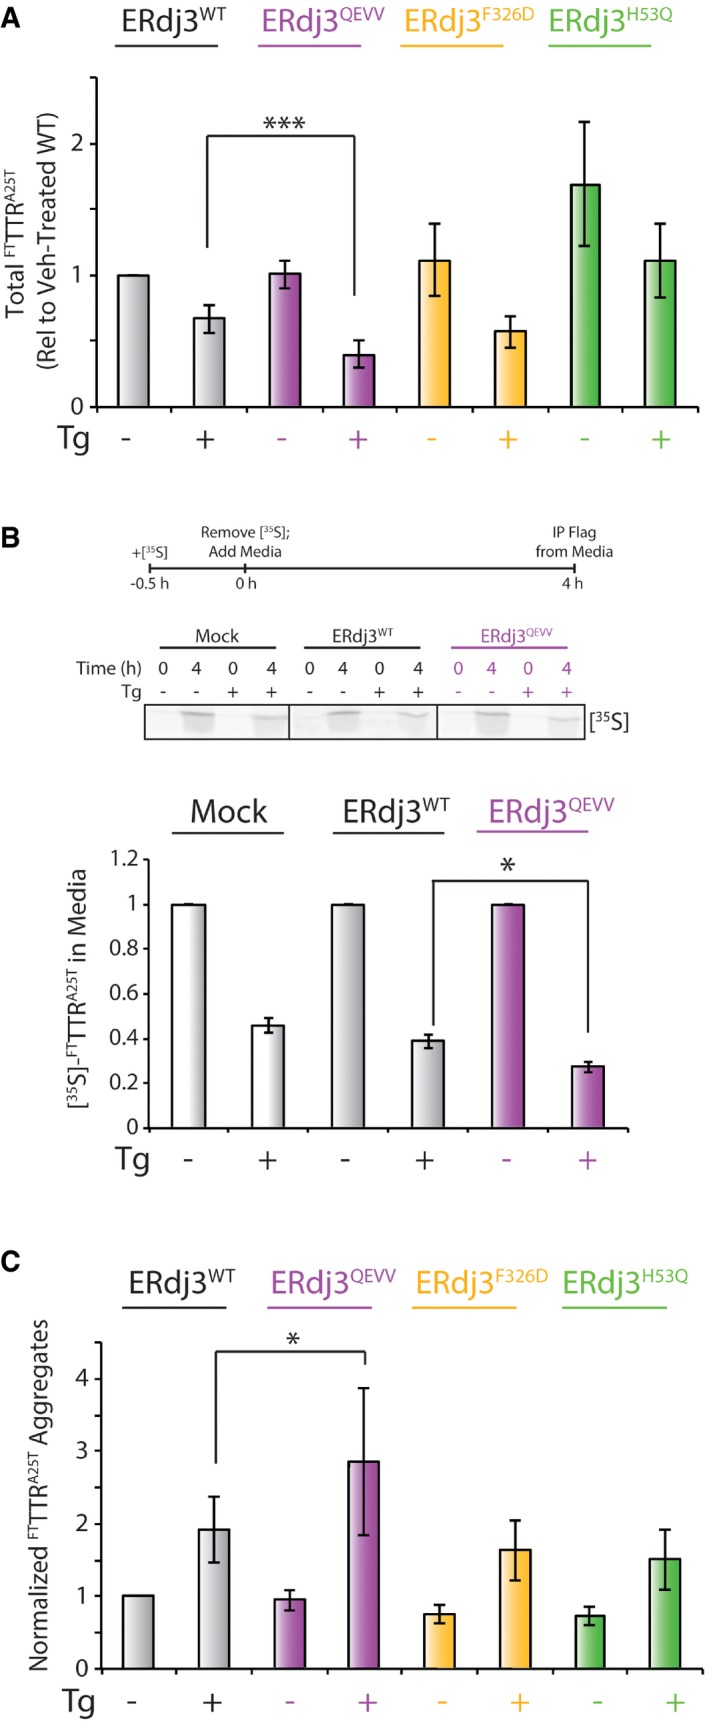
Figure EV4. Overexpression of ERdj3QEVV exacerbates Tg‐induced alterations in secretory proteostasis regulation for the destabilized, aggregation‐prone FTTTRA25T (related to Fig 6).

- Quantification of total FTTTRA25T in conditioned media measured by SDS–PAGE/immunoblotting. The levels of FTTTRA25T in conditioned media are shown relative to vehicle‐treated cells overexpressing ERdj3WT. Error bars show SEM for n = 5. ***P < 0.005 from a paired t‐test. A representative immunoblot for this quantification is shown in Fig 6B.
- Representative autoradiogram and quantification of HEK293T [35S]‐labeled FTTTRA25T in conditioned media prepared on HEK293 cells transfected with FTTTRA25T and ERdj3WT or ERdj3QEVV, as indicated. The [35S] metabolic labeling protocol is shown above. Error bars show SEM for n = 4. *P < 0.05 from a paired t‐test.
- Quantification of normalized FTTTRA25T aggregates in conditioned media measured by CN–PAGE/immunoblotting. Normalized FTTTRA25T aggregates were calculated by the following formula: normalized FTTTRA25T aggregates for a given condition X = [aggregate FTTTRA25T condition X/aggregate FTTTRA25T veh‐treated mock‐transfected cells]/[total FTTTRA25T condition X/total FTTTRA25T in veh‐treated mock‐transfected cells]. The data are shown relative vehicle‐treated cells transfected with ERdj3WT. Error bars show SEM for n = 5. *P < 0.05 from a paired t‐test.
