
Figure 5. Stable, dimeric ERdj3QEVV shows reduced binding to BiP and destabilized substrates.
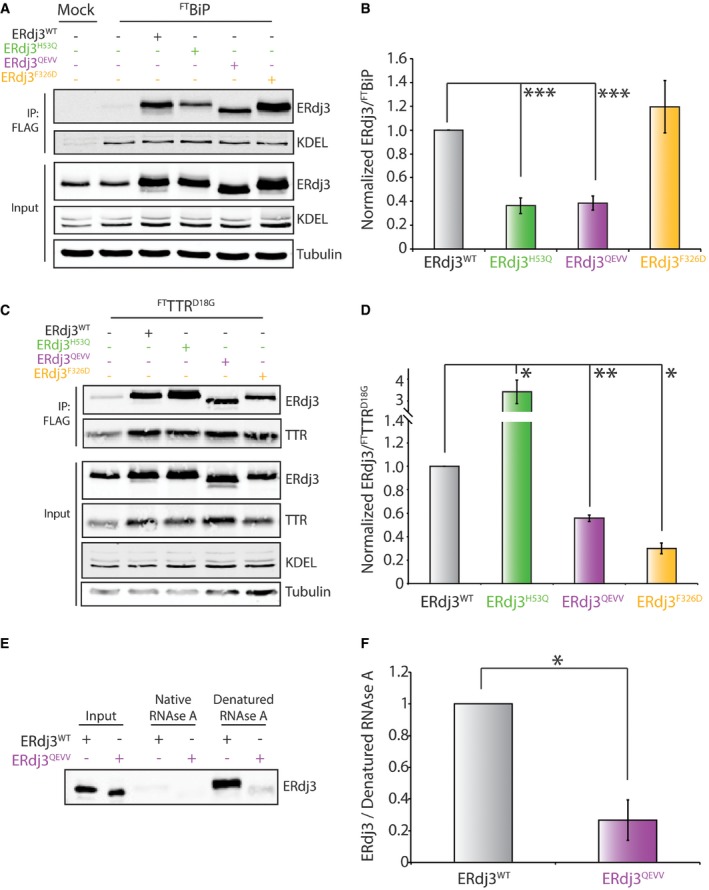
- Representative immunoblot for inputs and anti‐FLAG immunoprecipitations (IPs) of lysates prepared from HEK293T cells overexpressing FTBiP and the indicated ERdj3 mutant. Mock‐transfected HEK293T cells are included as a control. Cells were treated with the cell‐permeable, reversible crosslinker DSP prior to lysis to immortalize transient FTBiP‐ERdj3 interactions.
- Bar graph depicting quantification of ERdj3 mutants co‐immunopurifying with FTBiP from immunoblots as shown in (A). Data are shown normalized to ERdj3WT. Error bars represent standard error for n = 3. ***P < 0.005 from a paired t‐test.
- Representative immunoblots for inputs and anti‐FLAG immunoprecipitations (IPs) of lysates prepared from HEK293T cells co‐overexpressing FTTTRD18G and the indicated ERdj3 mutant. Mock‐transfected HEK293T cells are included as a control. Cells were treated with the cell‐permeable, reversible crosslinker DSP prior to lysis to immortalize transient FTTTRD18G‐ERdj3 interactions.
- Bar graph depicting quantification of ERdj3 mutants co‐immunopurifying with FTTTRD18G from immunoblots as shown in (C). Data are shown normalized to ERdj3WT. Error bars represent standard error for n = 3. *P < 0.05. **P < 0.01 from a paired t‐test.
- Representative immunoblot of secreted ERdj3WT or ERdj3QEVV from conditioned media collected from transfected HEK293T cells purified using an affinity Sepharose resin conjugated to native or denatured RNase A. Conditioned media containing ERdj3WT or ERdj3QEVV are shown as input.
- Bar graph depicting quantification of secreted ERdj3WT and ERdj3QEVV mutants associated with denatured RNase A beads as in (E). Data are normalized to ERdj3WT. Error bars represent standard error for n = 3. *P < 0.05 from a paired t‐test.
Source data are available online for this figure.