
Figure EV1. Transcriptional response to inhibitors of OGT and OGA (related to Fig 1).
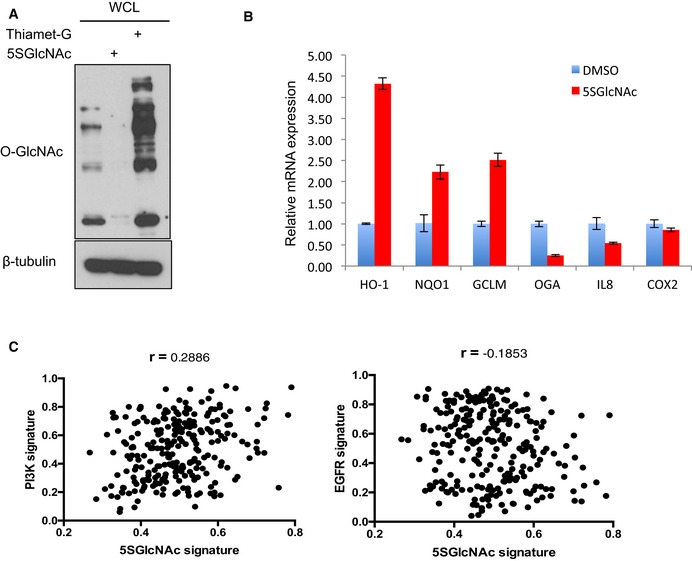
- OGT and OGA inhibitors reduced and increased, respectively, global O‐GlcNAc levels. MDA‐MB‐231 cells were treated with 50 μM 5SGlcNAc or 25 μM Thiamet‐G for 24 h and WCLs were analyzed by Western blots.
- qPCR validation of indicated up‐ and downregulated genes from microarray data. MDA‐MB‐231 cells were treated with DMSO vehicle or 50 μM 5SGlcNAc for 48 h and extracted mRNA was analyzed by qPCR (normalized to β‐actin). n = 3, error bars represent standard deviation.
- Lack of correlation between low‐OGT activity (i.e., 5SGlcNAc) and PI3K or EGFR signaling gene expression signatures when projected into the Miller breast tumor dataset. r = Pearson's correlation coefficient.
Source data are available online for this figure.