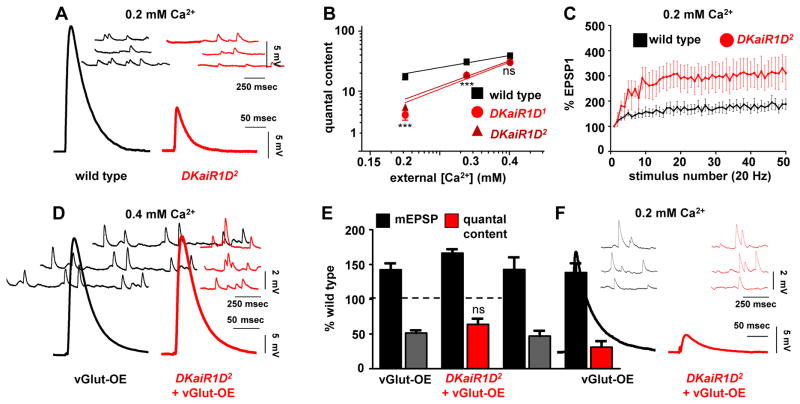
Figure 2. Altered calcium cooperativity and short term plasticity in DKaiR1D mutant synapses.
(A) Representative electrophysiological recordings at 0.2 mM extracellular Ca2+ reveals reduced baseline transmission in DKaiR1D2 mutants. (B) Quantal content in wild type, DKaiR1D1, and DKaiR1D2 mutants plotted as a function of extracellular Ca2+concentration on logarithmic scales. Note that DKaiR1D mutants have increased apparent slopes (wild type= 1.002; DKaiR1D1=2.248 (***), and DKaiR1D2=2.126 (***)). (C) Increased short term facilitation is observed in DKaiR1D2 mutants. EPSP values at each stimulus are normalized to the starting EPSP value during a train of 50 stimuli at 20 Hz. (D) Representative traces of homeostatically depressed synapses induced by presynaptic overexpression of the vesicular glutamate transporter alone (vGlut-OE: w;OK371-Gal4/UAS-vGlut) or in combination with the DKaiR1D mutation (DKaiR1D+vGlut-OE: w;OK371-Gal4/UAS-vGlut;DKaiR1D2). Note the increased mEPSP amplitude but normal EPSP amplitude, indicating a homeostatic decrease in quantal content. (E) Quantification of mEPSP amplitude and quantal content values normalized as a percentage of wild-type values. (F) Representative mEPSP and EPSP traces of the indicated genotypes at 0.2 mM extracellular Ca2+ concentrations. Note the large reduction in EPSP amplitude in DKaiR1D+vGlut-OE. Error bars indicate ±SEM. Asterisks indicate statistical significance using one-way analysis of variance (ANOVA), followed by Tukey’s multiple-comparison test: (*) p<0.05; (**) p<0.01; (***) p<0.001; (ns) not significant. Detailed statistical information for represented data (mean values, SEM, n, p) is shown in Table S1.

