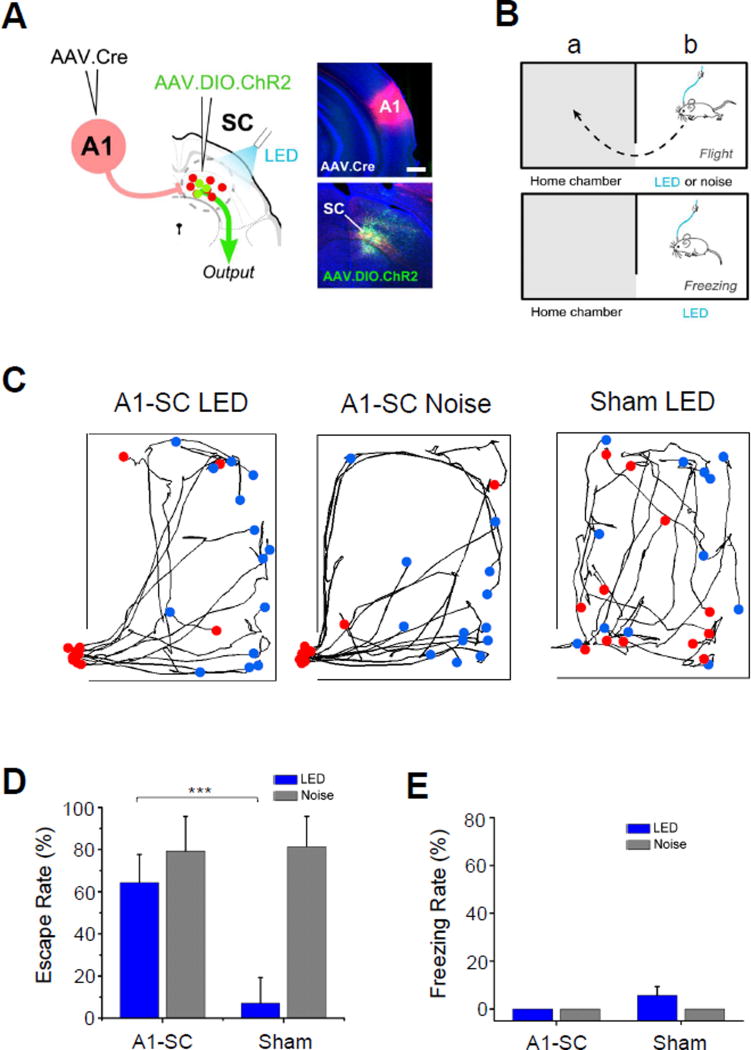
Figure 6. A1-recipient SC neurons drive an innate escape behavior.
(A) Schematic illustration of paired injections in A1 and SC, as well as LED illumination applied (A1-SC). Right panels, images of injection sites (red for tdTomato; green for ChR2) in an example animal. Scale bar: 500 µm.
(B) Schematic illustration of two-chamber behavior setup for testing freezing or escape.
(C) Movement tracking for an example A1-SC mouse under LED stimulation (left), A1-SC mouse under noise stimulation (middle) and sham mouse under LED stimulation (right) in the novel chamber during 5 s LED activation or 5 s noise stimulation. Each curve represents one trial. Blue dot indicates the starting location at the initiation of LED or noise stimulus, and red dot indicates the location at the end of the stimulus. Red dot beyond the novel chamber boundary indicates that the animal has returned to the adjacent home chamber within 5 sec (bottom left). For “sham”, AAV1-FLEX-GFP was injected in SC.
(D) Summary of percentage of trials that induced escape behavior (n = 7 mice for A1-SC group, n = 5 mice for sham). Error bar = SD. ***, p < 0.001, t test.
(E) Percentage of trials that induced freezing behavior. Error bar = SD.

