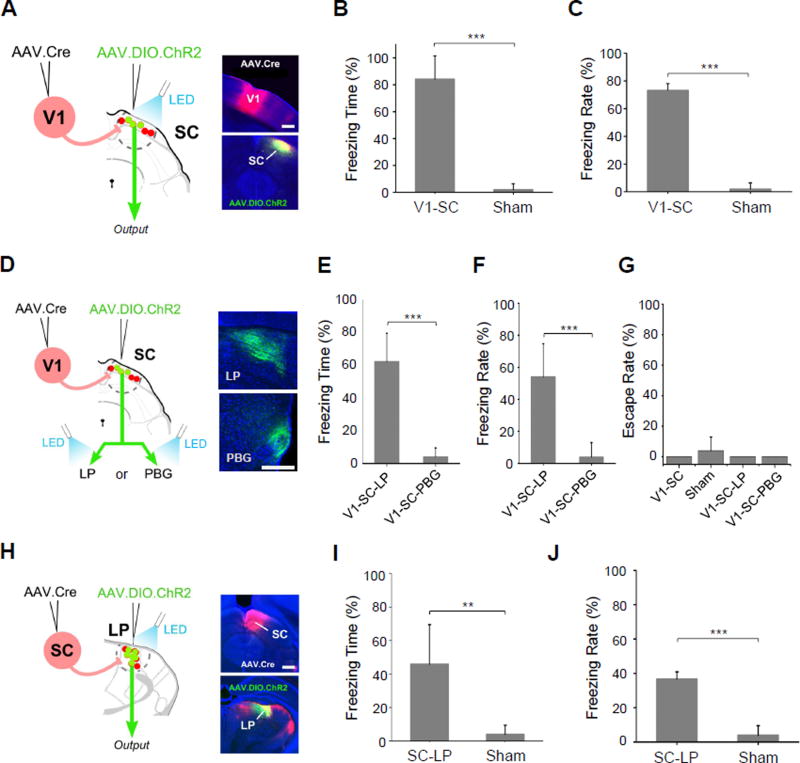
Figure 7. V1-recipent SC neurons drive freezing behavior.
(A) Paired injections labeling SC neurons receiving V1 input. LED illumination was applied to cell bodies in SC (V1-SC). Scale bar: 500 µm.
(B) Percentage of time spent freezing within the time window of LED illumination (n = 5 mice for each group). Error bar = SD. ***, p < 0.001, t test.
(C) Percentage of trials that induced freezing. ***, p < 0.001, t test.
(D) LED illumination was applied to ChR2+ SC axon terminals in either LP (V1-SC-LP) or PBG (V1-SC-PBG). Right, images showing ChR2 labeled SC axons in LP or PBG. Scale bar: 250 µm.
(E) Percentage of time spent freezing within the time window of LED illumination (n = 5 mice for each group). ***, p < 0.001, t test.
(F) Percentage of trials that induced freezing. ***, p < 0.001, t test.
(G) Percentage of trials that induced escape behavior.
(H) Paired injections labeling LP neurons that receive input from SC. LED illumination was applied to LP (SC-LP). Right panel, images showing injection sites in SC and LP. Scale bar: 500 µm.
(I) Percentage of time spent freezing within the time window of LED illumination (n = 6 mice for SC-LP, n = 5 mice for sham). Error bar = SD. **, p < 0.05, t test.
(J) Percentage of trials that induced freezing behavior. Error bar = SD. ***, p < 0.001, t test.

