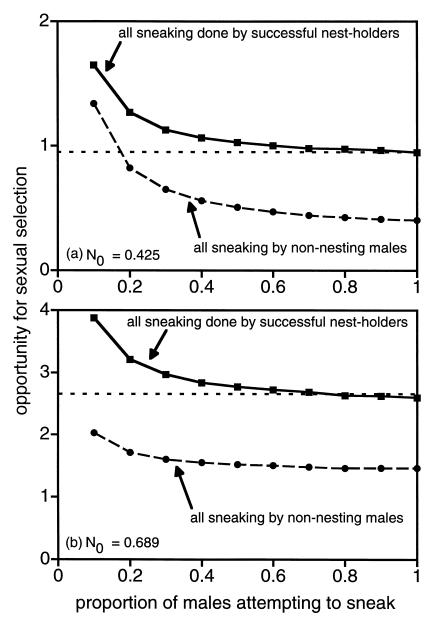
Figure 2.
The relationship between the proportion of males attempting to sneak and the opportunity for sexual selection based on variance in male mating success when (a) N0 = 0.425 or (b) N0 = 0.689. Squares (connected by a solid line) indicate the opportunity for sexual selection when all sneaking is done by a percentage of the nest holders (i.e., p0 = 0 and pnh ranges from 0.1 to 1.0). Circles (connected by a dashed line) indicate the results for the cases in which all sneaking is done by some percentage of nonnesting males (i.e., pnh = 0 and p0 ranges from 0.1 to 1.0). The horizontal dashed line in each graph corresponds to the opportunity for sexual selection in the absence of sneaking.

