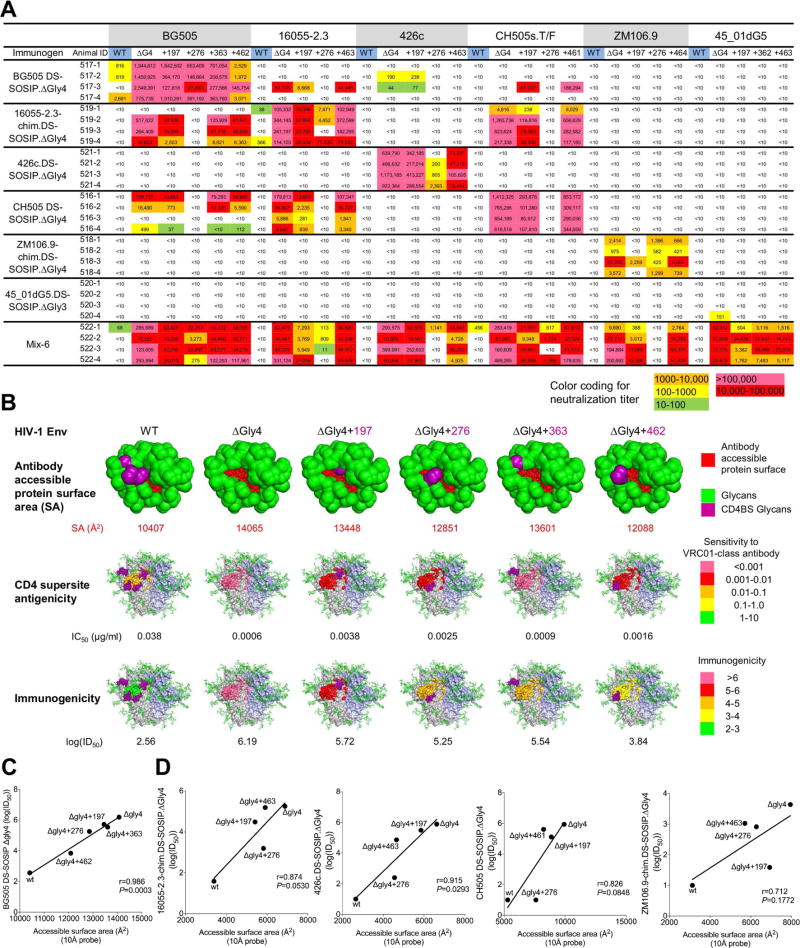
Figure 7. Mapping of guinea pig immune responses with 3-glycan-deleted viruses.
(A) Mapping immune responses by neutralization of wild type, 4-glycan-deleted and 3-glycan-deleted viruses that restored each of the individual glycans from the 4-glycan-deleted viruses (marked with “+” and the glycan position).
(B) Visualization of elicited antibody responses against BG505 wild type, 4-glycan-deleted and 3-glycan-deleted viruses for the guinea pig group immunized with 4-glycan-deleted BG505.DS-SOSIP. Antibody accessible - protein surface areas at different glycan-deleted states are shown along with antigenicity to VRC01-like antibodies and immunogenicity are colored as indicated.
(C) Pearson correlation of mean antibody accessible-protein surface area extracted from Man5 glycosylated BG505 SOSIP molecular dynamics simulation (calculated using a 10 Å probe by Naccess) with BG505-DS SOSIP ΔGly4 immunogenicity (log(ID50)), for WT, ΔGly4, and ΔGly3 BG505 viruses.
(D) Pearson correlations between antibody accessible-protein surface area and immunogenicity (log(ID50) for WT, ΔGly4, and ΔGly3 viruses, left to right in the order of 16055-2.3-chim.DS-SOSIP ΔGly4, 426c.DS-SOSIP ΔGly4, CH505 DS-SOSIP ΔGly4, and ZM106.9-chim.DS-SOSIP ΔGly4. Accessible surface areas were calculated based on Man5-glycosylated homology models with a 10Å probe using Naccess.

