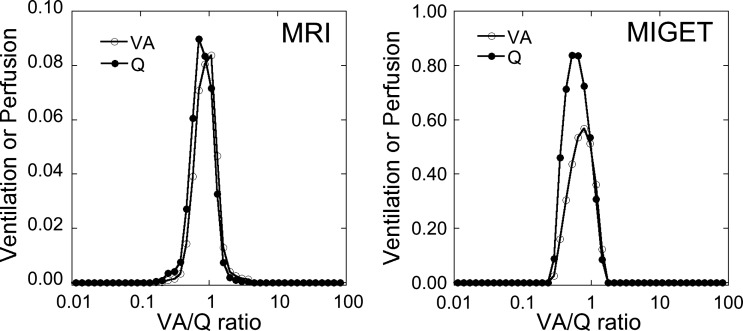
Fig. 2.
Recovered V̇A/Q̇ distributions from MRI (A) and MIGET (B) from the subject shown in Fig. 1. The scale for the y-axis for MRI data is ~10% that of MIGET because MIGET data are for the whole lung whereas the MRI data are for a single slice only.

