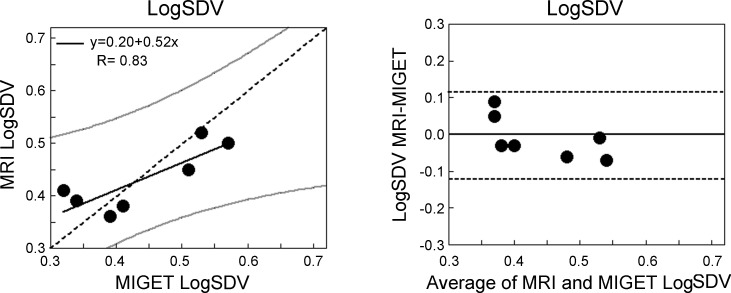
Fig. 4.
Left: the regression of the LogSDV̇ derived from MRI compared with that from MIGET. The two measures were well correlated (R = 0.83, P = 0.02). Dotted line is the line of identity, gray lines are the 95% confidence limits for the relationship. The slope of the relationship was significantly different from the line of identity (P = 0.01) and the intercept was also significantly different from zero (P = 0.02). Right: the corresponding Bland-Altman plot. Dotted lines are the 95% confidence limits. The average bias between techniques was −0.01.

