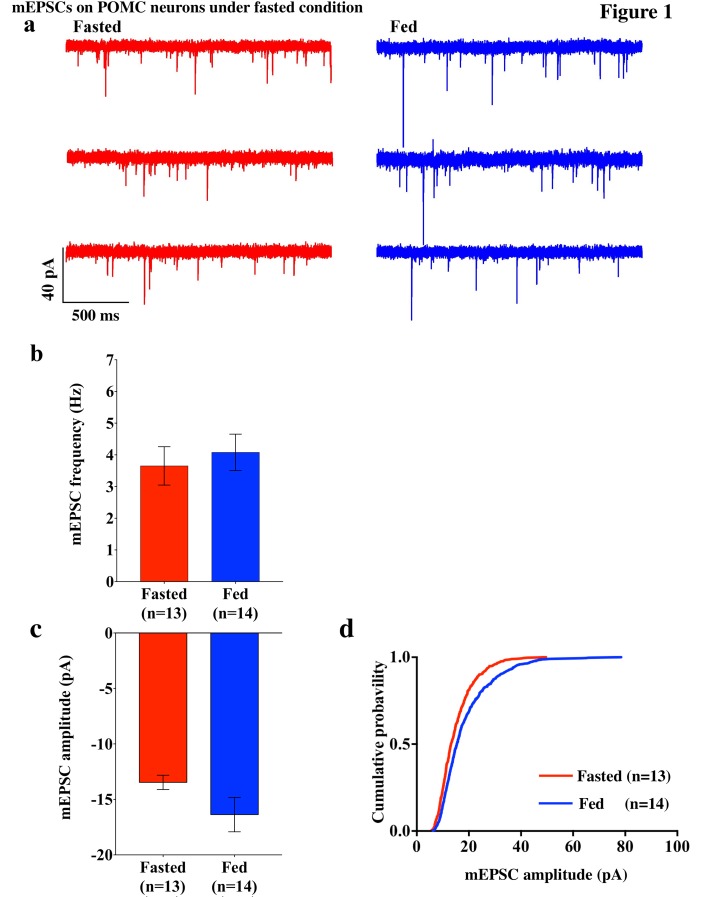
Figure 1. mEPSCs on POMC neurons was decreased by fasting.
(a) Representative trace of mEPSCs on POMC neurons. Scale bar indicates 40 pA on vertical and 500 ms on horizontal. (b) mEPSC frequency (mean ± SEM) did not change significantly between overnight fasting (red) and ad lib feeding conditions (blue). (c) Averaged median mEPSC amplitude (mean ± SEM) of POMC neurons tended to decrease under fasting (red) than feeding (blue) conditions. (d) Cumulative probability of mEPSC amplitude under fasting condition (red) decreased significantly than under feeding condition (blue) (* indicates p<0.01, Kolmogorov-Smirnov test).

