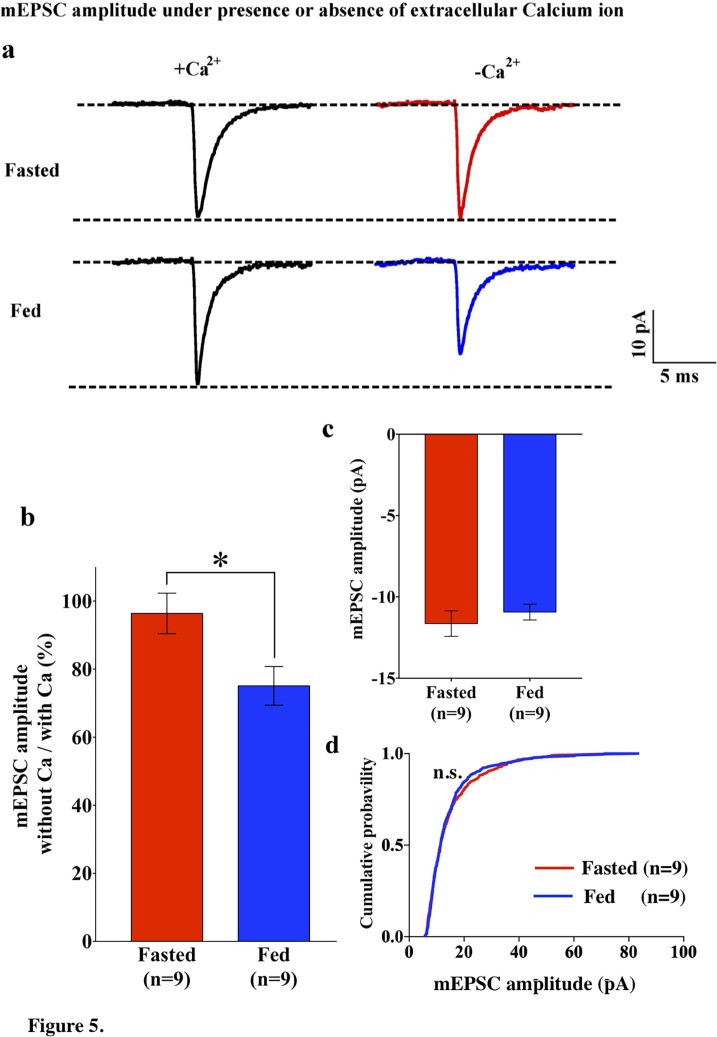
Figure 5. mEPSC without extracellular calcium did not change under fasting, whereas it decreased under feeding conditions.
(a) Representative traces of mEPSC with calcium (left) and without calcium (right) under fasting (top) and feeding (bottom) conditions. Scale bar indicates 10 pA on vertical and 5 ms on horizontal. (b) The ratio of mEPSC amplitude without calcium/with calcium decreased under the feeding (blue) but remained unchanged under fasting (red). (c) mEPSC distribution did not change between fasting and feeding (blue) in Ca2+-free ACSF (p>0.05, Kolmogorov-Smirnov test) (d) Averaged median mEPSC amplitude did not change between fasting and feeding in Ca2+-free ACSF.

