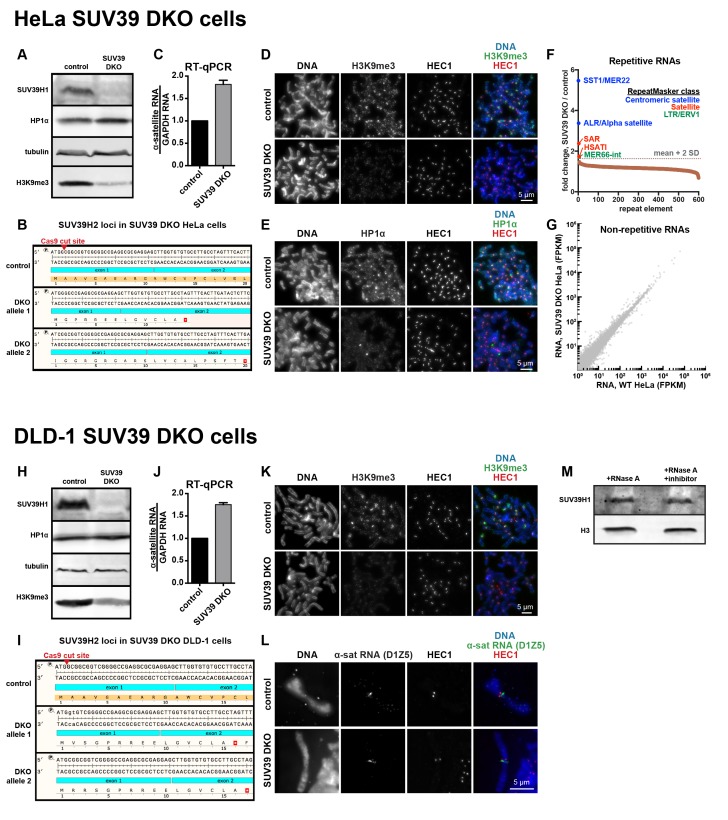
(A) Western blot analysis of HeLa SUV39 DKO cells, assessing total SUV39H1, HP1α, tubulin, and H3K9me3 levels. (B) Analysis of SUV39H2 loci in HeLa SUV39 DKO cells. A section of the SUV39H2 gene surrounding the targeted Cas9 cut site was PCRed from genomic DNA and sequenced. Two mutant alleles were identified, and both lead to an early translation termination of SUV39H2. (C) α-satellite RNA levels in HeLa SUV39 DKO cells were measured by reverse transcription followed by quantitative PCR (RT-qPCR). Total RNA was isolated from HeLa control and HeLa SUV39 DKO cells, then reverse transcribed and amplified with α-satellite or GAPDH primers. Shown is average of 5 independent measurements, normalized to control cells, error bars are standard error. (D) H3K9me3 localization in control or SUV39 DKO HeLa cells. Mitotic cells were spread onto coverslips, then stained for DNA (blue), H3K9me3 (green), and HEC1 (red) to mark core centromere/kinetochore regions. (E) HP1α localization in control or SUV39 DKO HeLa cells. Mitotic cells were spread onto coverslips, then stained for DNA (blue), HP1α (green), and HEC1 (red) to mark core centromere/kinetochore regions. (F) Analysis of repetitive RNAs in HeLa SUV39 DKO cells. Total RNA was isolated from HeLa control and HeLa SUV39 DKO cells, and a cDNA library was generated and sequenced. Fold change in RNAs (SUV39 DKO / control) transcribed from different repeat types were plotted as a rank order from highest to lowest. Repeat types with over 300 reads were included. The horizontal gray dotted line represents a cutoff of 2 standard deviations from the mean of the dataset. Brown dots represent repeat types that fall under two standard deviations from the mean. Repeats that were enriched more than two standard deviations from the mean are labeled, and colors represent the RepeatMasker broad repeat class to which that repeat type belongs. (G) Comparative analysis of non-repetitive RNA levels in HeLa control and HeLa SUV39 DKO cells. RNA was isolated and sequenced as described in F, and non-repetitive (uniquely mapping) RNAs were analyzed. FPKM: Fragments Per Kilobase of transcript per Million mapped reads. (H) Western blot analysis of DLD-1 SUV39 DKO cells, assessing total SUV39H1, HP1α, tubulin, and H3K9me3 levels. (I) Analysis of SUV39H2 loci in DLD-1 SUV39 DKO cells. A section of the SUV39H2 gene surrounding the targeted Cas9 cut site was PCRed from genomic DNA and subjected to MiSeq sequencing. Two mutant alleles were identified, and both lead to an early stop in the translation of SUV39H2. (J) α-satellite RNA levels in DLD-1 SUV39 DKO cells were measured by reverse transcription followed by quantitative PCR (RT-qPCR). Total RNA was isolated from DLD-1 control and DLD-1 SUV39 DKO cells, then reverse transcribed and amplified with α-satellite or GAPDH primers. Shown is average of 5 independent measurements, normalized to control cells, error bars are standard error. (K) H3K9me3 localization in control or SUV39 DKO DLD-1 cells. Mitotic cells were spread onto coverslips, then stained for DNA (blue), H3K9me3 (green), and HEC1 (red) to mark core centromere/kinetochore regions. (L) α-satellite RNA localization in control or SUV39 DKO DLD-1 cells. Mitotic cells were spread onto coverslips, then stained for DNA (blue), α-satellite (D1Z5 probe, green), and HEC1 (red) to mark core centromere/kinetochore regions. (M) Western blot showing SUV39H1 and histone H3 protein levels in cell lysates treated with RNase A or RNase A plus RNase inhibitors.


