. 2017 Aug 1;6:e25299. doi: 10.7554/eLife.25299

Figure 4. Identification and biochemical characterization of SUV39H1 RNA binding-deficient mutants.

(A) Identification of SUV39H1 mutants that affect RNA binding. Binding curves from second round of EMSA screening showing the binding of purified MBP-SUV39H1 42–106 point mutants to 19mer RNA (table of measured dissociation constants in Figure 4—figure supplement 1B). (B) Crystal structures of the chromodomains of human SUV39H1 (aa 44–91) (Wang et al., 2012) and human HP1α (aa 18–68) bound to H3K9me3 peptide (yellow) (Kaustov et al., 2011). Residues in SUV39H1 important for RNA binding (red and blue) or H3K9me3 binding (green and orange) are highlighted. The H3K9me3 peptide was co-crystalized with HP1α, but not SUV39H1. (C) Quantification of WT SUV39H1, SUV39H1R55A, and SUV39H1R84A binding to 19mer RNA. Binding curves generated by quantifying filter binding assays shown in Figure 4—figure supplement 1D. Error bars are standard deviation from three independent experiments. Dissociation constants (Kd, μM) displayed on graph are determined by non-linear fitting of the binding curves. Standard error represents the error of the curve fitting to the average of the three experimental replicates. (D) Coomassie stained gel of purified MBP-SUV39H1 42–106 proteins – WT, F43A, R55A, or R84A. (E) Binding of SUV39H1 mutants to H3K9me3. Representative α-MBP western blot showing the amount of purified MBP-SUV39H1 42–106 protein, WT or indicated mutant, bound to streptavidin beads conjugated to either H3K9me0 (me0), H3K9me3 (me3), or no peptide (-) added. (F) Quantification of western blot shown in 4E, error bars are standard deviation, n = 3, *p<0.03. See also Figure 4—figure supplement 1.

DOI: http://dx.doi.org/10.7554/eLife.25299.010

Figure 4.

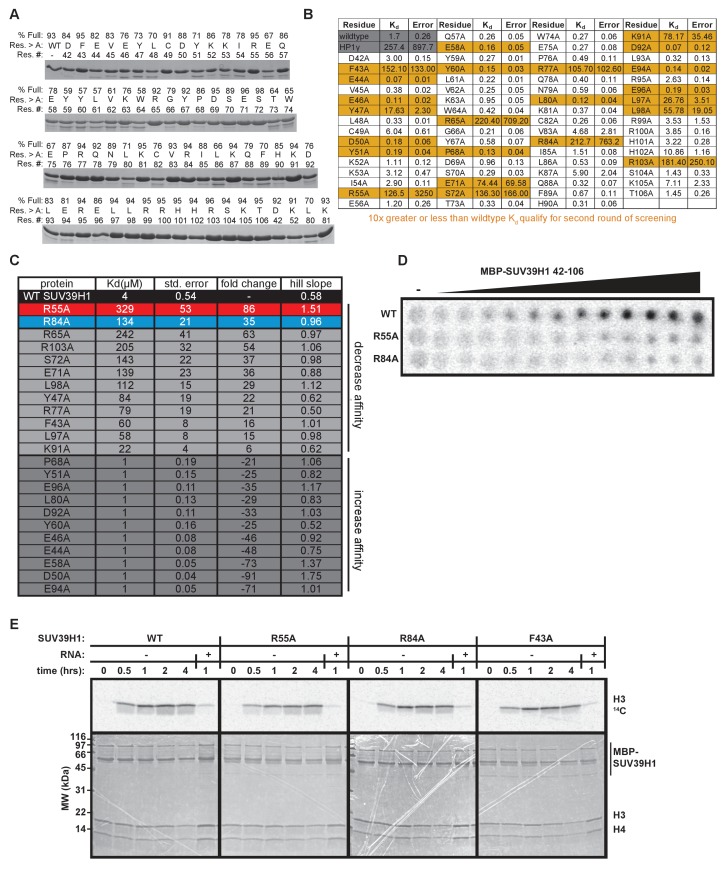
Figure 4—figure supplement 1. In vitro characterization of SUV39H1 chromodomain mutants.

Figure 4—figure supplement 1.

(A) Coomassie stained gels showing purified MBP-SUV39H1 42–106 alanine point mutants. Percent full length protein calculated by dividing (signal of the top band) / (signal of the top band + signal of the bottom band). Res. #, residue number; res. > A, residue mutated to alanine; % full, percent full-length protein. (B) Table displaying the results from the first round of EMSA screening to measure the binding of MBP SUV39H1 42–106 to a random 19mer ssRNA (sense). Dissociation constants (Kd, μM) displayed on graph are determined by non-linear fitting of the binding curves. Standard error represents the error of the curve fitting to one experiment consisting of 6 protein concentrations analyzed for each mutant. Highlighted mutants (yellow) have either 10-fold greater or less RNA binding affinity compared to WT, and were re-measured in the second round of EMSAs (Figure 4A, Figure 4—figure supplement 1C). (C) Table showing dissociation constants (Kd, μM), standard error, Hill slope, and affinity fold-change compared to WT SUV39H1, of point mutants during the second round of EMSAs. Standard error represents the error of the curve fitting to one experiment consisting of 9 protein concentrations analyzed for each mutant and three independent experiments for WT SUV39H1. (D) Representative filter binding assay measuring RNA binding of WT SUV39H1, SUV39H1R55A, and SUV39H1R84A to random sense 19mer RNA. Quantification shown in Figure 4C. Purified proteins shown in Figure 4D, diluted 2-fold from 200 μM. (E) Histone methyltransferase assay comparing the activity of WT SUV39H1 to SUV39H1 point mutants. Full length purified MBP-SUV39H1 was incubated with purified H3/H4 tetramer and radioactive methyl donor (14C S-adenosyl methionine), +/- RNA, then run on a denaturing gel. Histone H3 methylation was detected with a phosphorimager (top panels), and proteins were visualized by Coomassie staining (bottom panels).