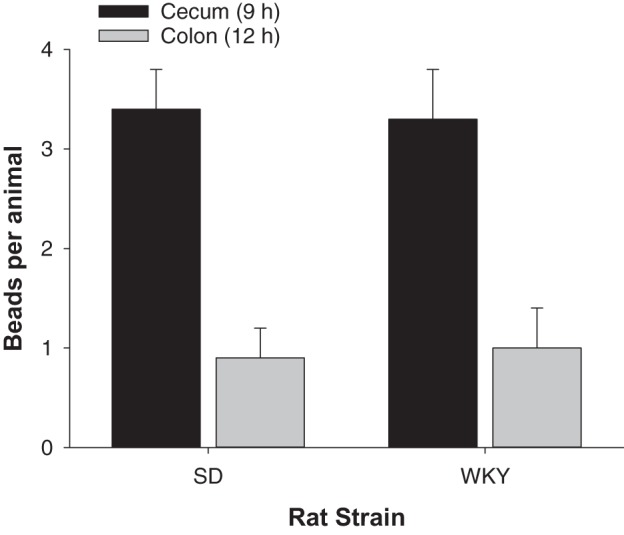
Fig. 4.

Cecum to colon transit. The number of beads per animal that moved from the cecum at 9 h (black) to the colon at 12 h (gray) are shown for Sprague-Dawley (SD) compared with Wistar-Kyoto (WKY) rats (n = 7–11 animals per group). Data show means ± SE.
