Fig. 5.
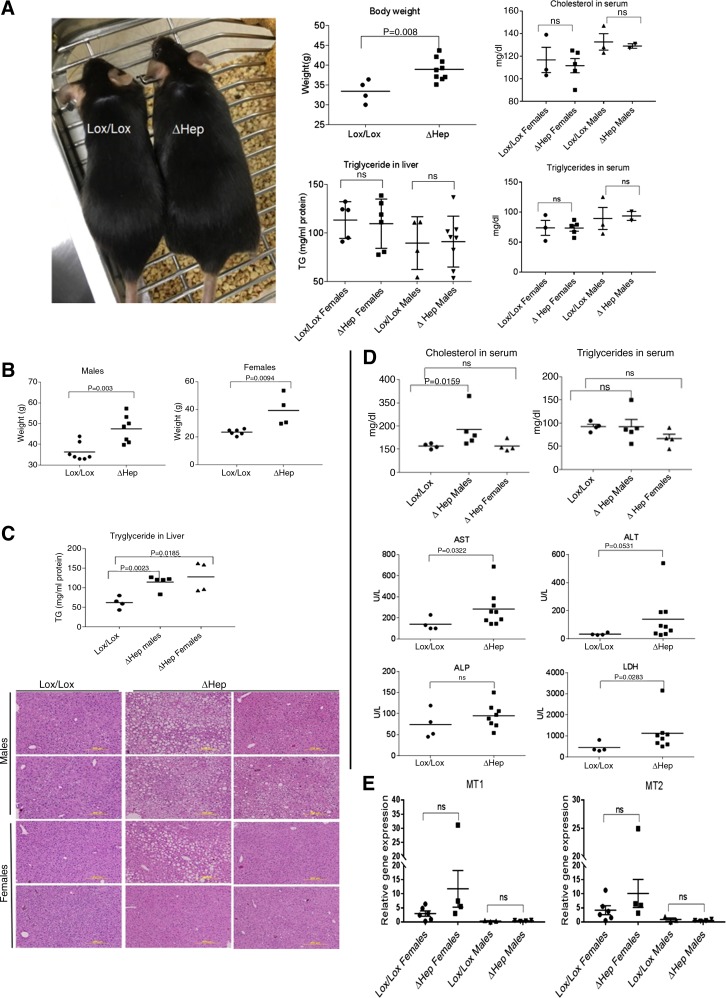
Atp7bΔHep mice show dysregulated lipid metabolism and steatosis. A, left: representative image illustrating a size difference between the Atp7bΔHep male and a sex-matched Atp7bLox/Lox control. Middle top: weight difference between Atp7bΔHep and Atp7bLox/Lox male mice (n = 4–9). Middle bottom: triglyceride levels in Atp7bΔHep and Atp7bLox/Lox livers at 20 wk after birth (n = 4–8 per sex and per phenotype). Right: cholesterol and triglyceride levels in serum of 20-wk-old animals (n = 2–5). B: weight increase of Atp7bΔHep and Atp7bLox/Lox mice at 45 wk after birth (n = 4–7). C, top: triglyceride (TG) levels in liver at 45 wk (n = 4–5). Sex-related difference in triglyceride levels was not observed for control Lox/Lox animals, and the corresponding data were combined. Bottom: representative hematoxylin and eosin staining of liver sections. D, top: cholesterol and triglyceride levels in serum at 45 wk. Bottom: liver injury markers in a serum of 45-wk-old mice. E: MT1 and MT2 expression in the liver at 45 wk after birth (n = 4–9 per genotype; data were analyzed using unpaired 2-tailed t-test).

