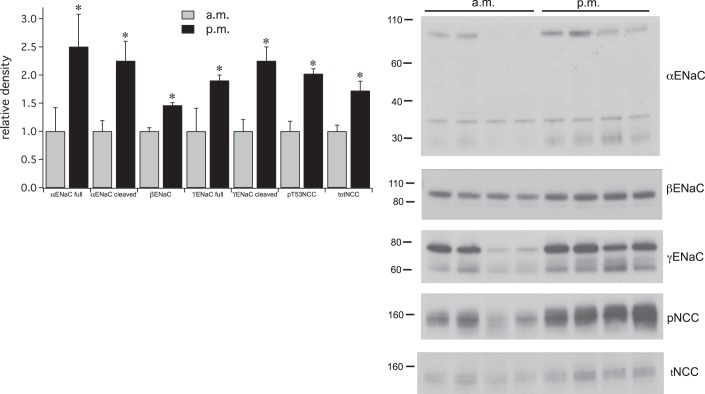
Fig. 9.
Effects of diurnal Na depletion on ENaC and pNCC expression. Right: Western blots showing expression of ENaC subunits and NCC and pNCC before and after dietary Na restriction for 9 h. Left: densitometric analysis. Data represent means ± SE for 8 animals. *Statistical significance (P < 0.05).

