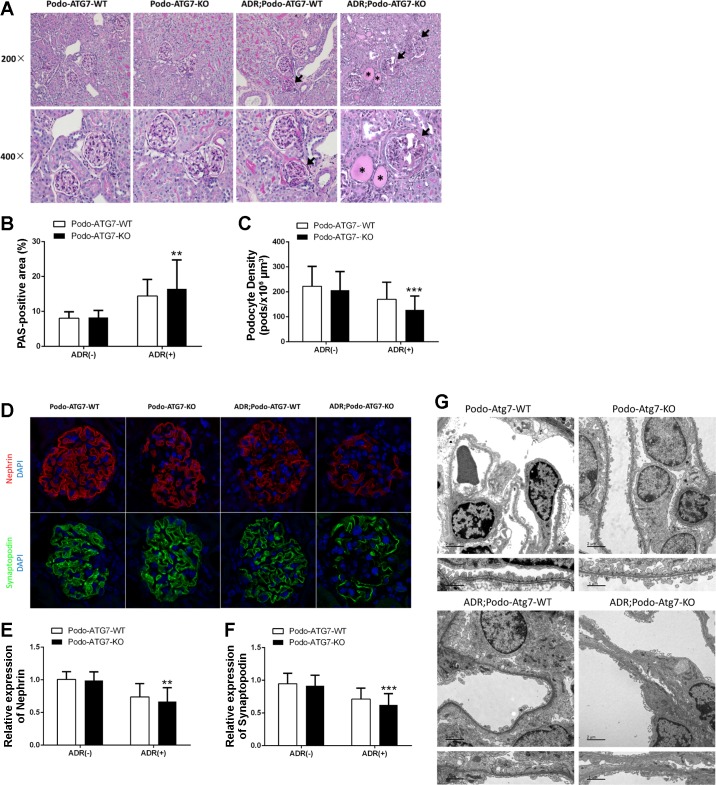
Fig. 7.
Adriamycin-induced podocyte injury is aggravated in Podo-Atg7-KO mice. Following tamoxifen induction, Podo-Atg7-WT and Podo-Atg7-KO mice were injected with 19.5 mg/kg adriamycin (or saline as control) to collect kidney tissues for analysis 8 wk later. A: representative images of periodic acid-Schiff (PAS) staining showing glomerulosclerosis (arrows) and tubular protein cast (asterisks). Original magnification, ×200 in top row, ×400 in bottom row. B: quantification of PAS-positive area. n = 5 mice in each condition; 20 glomeruli were evaluated in each mouse; **P < 0.01 vs. adriamycin; Podo-Atg7-WT group. C: quantification of the density of podocytes. n = 5 mice in each condition; 20 glomeruli were evaluated in each mouse; ***P < 0.005 vs. adriamycin; Podo-Atg7-WT group. D: representative images of immunofluorescence staining of nephrin (red) and synaptopodin (green) showing the loss of these podocyte marker proteins during adriamycin treatment, especially in Podo-Atg7-KO mice. Nuclei were labeled by DAPI (blue). E and F: quantification of nephrin and synaptopodin expression. The immunofluorescence signal of adriamycin-treated mice glomeruli was normalized with that of control [adriamycin (−)] mice, which was arbitrarily set as 1. n = 5 mice in each condition; 20 glomeruli were evaluated in each mouse; **P < 0.01, ***P < 0.005 vs. adriamycin; Podo-Atg7-WT group. G: representative EM micrographs of kidney tissues from Podo-Atg7-WT and Podo-Atg7-KO mice showing adriamycin-induced podocyte disruption including foot process effacement, especially in Podo-Atg7-KO tissues. Scale bars: 2 μm (top), 1 μm (bottom).

