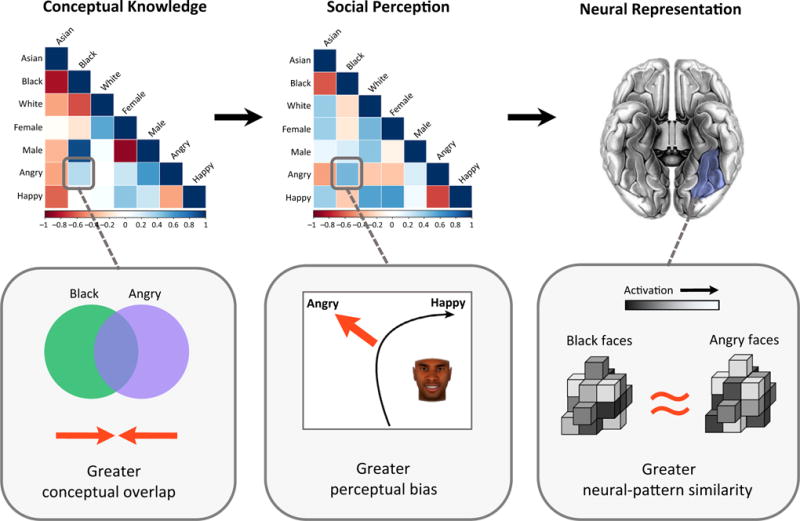
Figure 4. The Inherent Intersection of Social Categories.

Illustration of the MVPA representational similarity analysis findings of [91]. At the top left, an example dissimilarity matrix (DM) depicts the similarity/dissimilarity in conceptual knowledge of all pairwise gender, race, and emotion categories, based on trait ratings regarding social categories (no faces involved). Blue colors indicate similarity and red colors indicate dissimilarity. For instance, the Black and Angry categories tended to be similar, indicating conceptual overlap (bottom left). At the top middle, another example DM depicts the similarity/dissimilarity in perceptions based on mouse-tracking data, where similarity indicates bias. For instance, Black and Angry faces tended to elicit similar mouse-tracking patterns, such as a greater bias to perceive Black faces as ‘Angry’ even when not displaying angry cues (bottom middle). The structure of the conceptual DM significantly predicted the structure of the perceptual DM, which in turn predicted the structure of multi-voxel patterns in the fusiform gyrus (FG) (and orbitofrontal cortex, OFC). Thus,in this example, a greater conceptual overlap between Black and Angry categories predicted a greater bias to perceive faces belonging to those categories similarly (e.g., Black faces as angry), and this in turn predicted a greater similarity in multi-voxel patterns for the Black and Angry categories when viewing such faces in the scanner.
