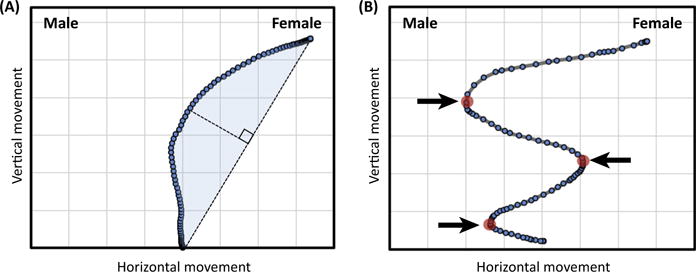
Figure I. Mouse-Tracking Measures for Understanding Cognitive Dynamics.

A ‘hidden’ partial activation of the male category is illustrated, indicated by the attraction of the hand to the male category response. (A) The magnitude or strength of the activation can be measured by maximum perpendicular deviation (broken line) or area under the curve (blue highlight) relative to an idealized straight-line response trajectory (examples in Figure 2A,B in main text). (B) The stability or instability of category activation dynamics can be measured by the number of abrupt directional changes along the horizontal x axis (axis of decision) (example in Figure 2C in main text).
