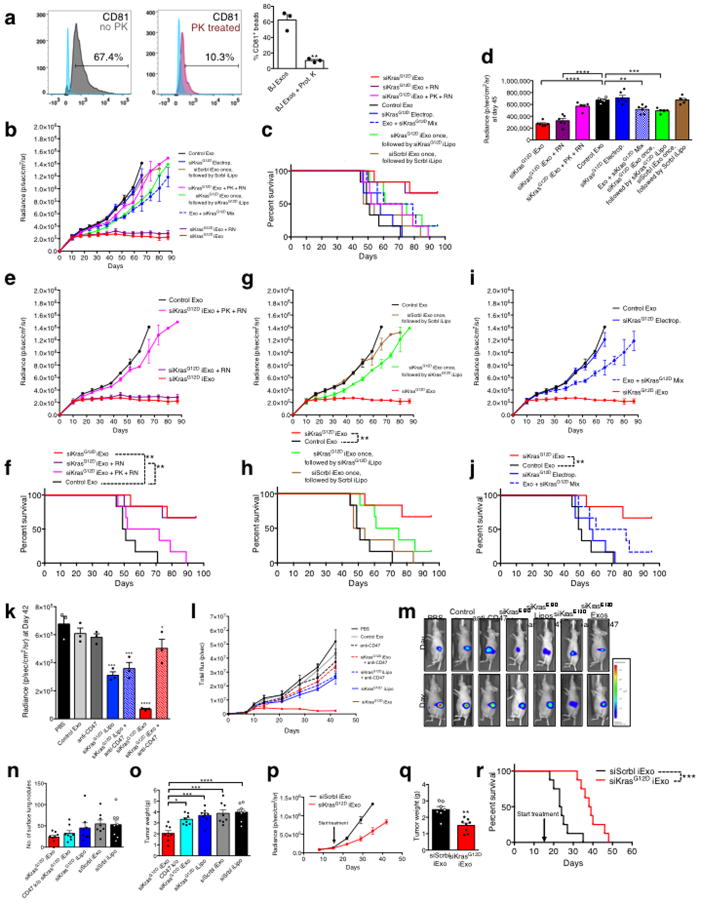
Extended Figure 6. Anti-tumor response of iExosomes in orthotopic models.
(A) FC analyses and quantification of CD81 on exosomes under listed conditions, n=3 independent experiments. (B) Bioluminescence from Panc-1 orthotopic tumors over time, n=6 mice per group. (C) Kaplan-Meier curve of Panc-1 tumor bearing mice. Log-rank Mantel-Cox test, n=6 mice in each group. (D) Tumor bioluminescence at day 45, n=6 mice per group. One-way ANOVA. (E–J) Bioluminescence from Panc-1 orthotopic tumors over time depicting separate groups, from panel B, and Kaplan-Meier curve depicting the separate groups, from panel C, Log-rank Mantel-Cox test. n=6 mice per group. (K) Tumor bioluminescence at day 42, n=3 mice per group. Experimental groups compared to the PBS control group, one-way ANOVA. (L) Bioluminescence from Panc-1 orthotopic tumors over time (total flux), n=3 mice per group. (M) Luciferase activity at day 10 and day 42-post cancer cell (Panc-1) injection. (N) Surface lung nodules of KPC689 mice, n=8 mice per group. (O) Tumor weights (g: grams), n=8 mice per group, siKrasG12D iExo group is compared to other treatment groups, one-way ANOVA. (P) Bioluminescent KPC689 orthotopic tumors in nu/nu mice, n=8 mice per group. (Q) Tumor weights (g: grams), n=8 mice per group. (R) Kaplan-Meier curve of KPC689 nu/nu mice. Log-rank Mantel-Cox test, n=8 in each group. The data is presented as the mean ± SEM. Unless otherwise stated, unpaired two-tailed t test was used to determine statistical significance. ** p< 0.01, *** p<0.001, **** p<0.0001. See accompanying source data.

