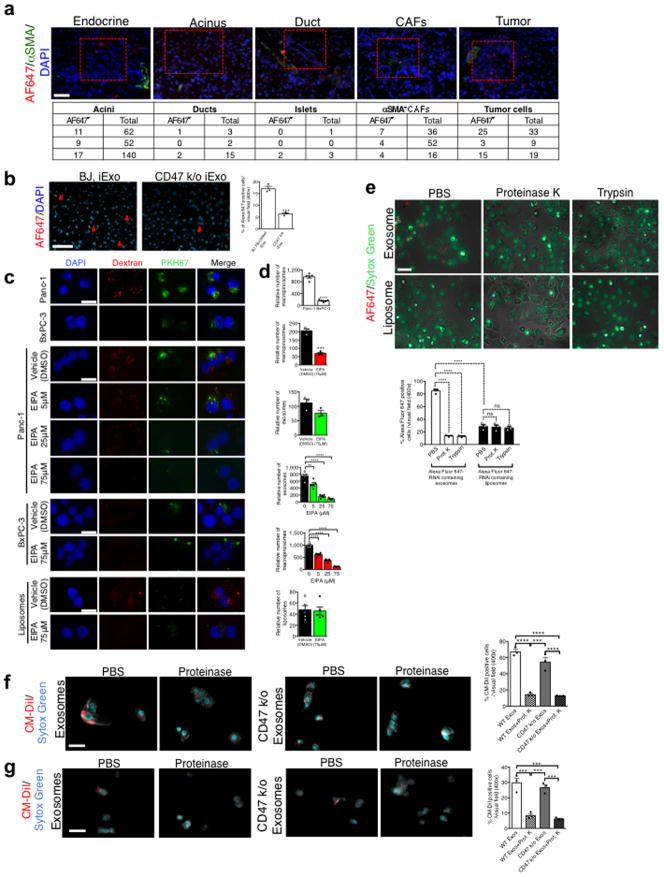
Extended Figure 7. Pancreas localization and macropinocytosis promotes iExosomes uptake into tumor cells.
(A) Quantification and representative pictures (scale bar: 100μm) of pancreas structure in KTC mice injected with exosomes with AF647 tagged siRNA, n=3 mice. (B) Quantification and representative images (scale bar: 100μm) of pancreas of mice injected with the indicated conditions, n=3 mice, unpaired two-tailed t test. (C) Representative images (scale bar: 50μm) for data presented in Fig. 3E–H. (D) Quantification of macropinocytic and exosomes uptake (independent experiment, identical statistical analyses). (E) AF647 RNAi-tagged exosomes/liposomes uptake in Panc-1 cells (scale bar: 100μm). n=3 independent experiments. (F) CM-DiI tagged CD47 k/o vs. WT exosomes uptake in Panc-1 cells (scale bar: 100μm). n=3 independent experiments. (G) CM-DiI tagged CD47 k/o vs. WT exosomes uptake in BxPC-3 cells (scale bar: 100μm). n=3 independent experiments. The data is presented as the mean ± SEM. Unless otherwise stated, one-way ANOVA was used to determine statistical significance. ns: not significant. * p<0.05, ** p< 0.01, *** p<0.001, **** p<0.0001. See accompanying source data.

