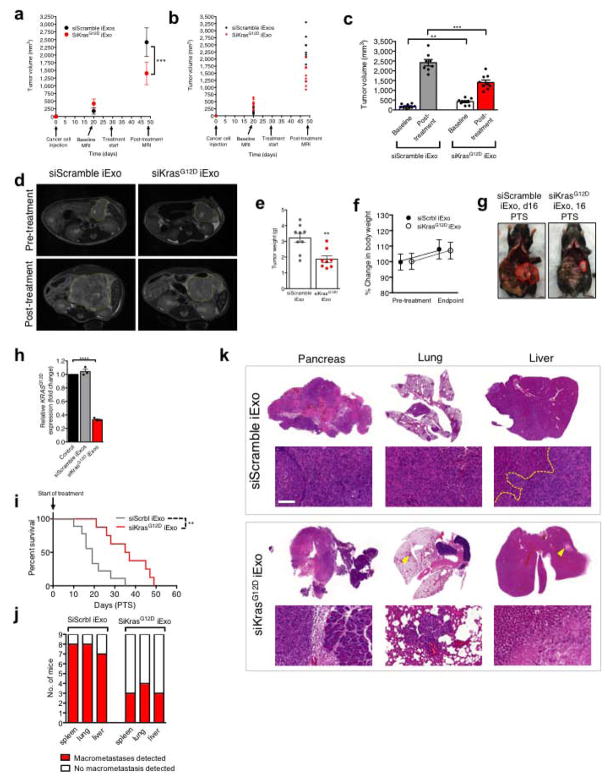
Extended Figure 10. iExosomes suppress pancreas cancer progression in KPC orthotopic mouse model.
(A–B) Magnetic Resonance Imaging (MRI) of KPC orthotopic tumors n=9 mice per group (A) and each individual tumor (B). (C) Tumor volume as measured by MRI n=9 mice per group. One-way ANOVA. (D) Representative axial images. (E) Tumor weight (g: grams) at the experimental end point. siScrbl iExo: n=9 mice, siKrasG12D iExo: n=8 mice. (F) Change in the percentage of mouse body weights, pre and post treatment (endpoint), n=9 mice per group. (G) Representative gross images of two KPC orthotopic mice that died on day 16 PTS (siScrbl iExo) or was euthanized on day 16 PTS (siKrasG12D iExo). (H) KrasG12D transcript levels in KPC689 cells (n=3 independent experiments). One-way ANOVA. (I) Kaplan-Meier curve of KPC orthotopic tumor bearing mice, Log-rank Mantel-Cox test. siScrbl iExo group: n=9 mice, siKrasG12D iExo group: n=8 mice. (J) Macroscopic metastatic nodules, n=9 mice per group. (K) H&E stained tissues. Unless stated otherwise, the data is presented as the mean ± SEM and unpaired two-tailed t test was used to determine statistical significance. * p<0.05, ** p< 0.01, *** p< 0.001, **** p<0.0001. See accompanying source data.

