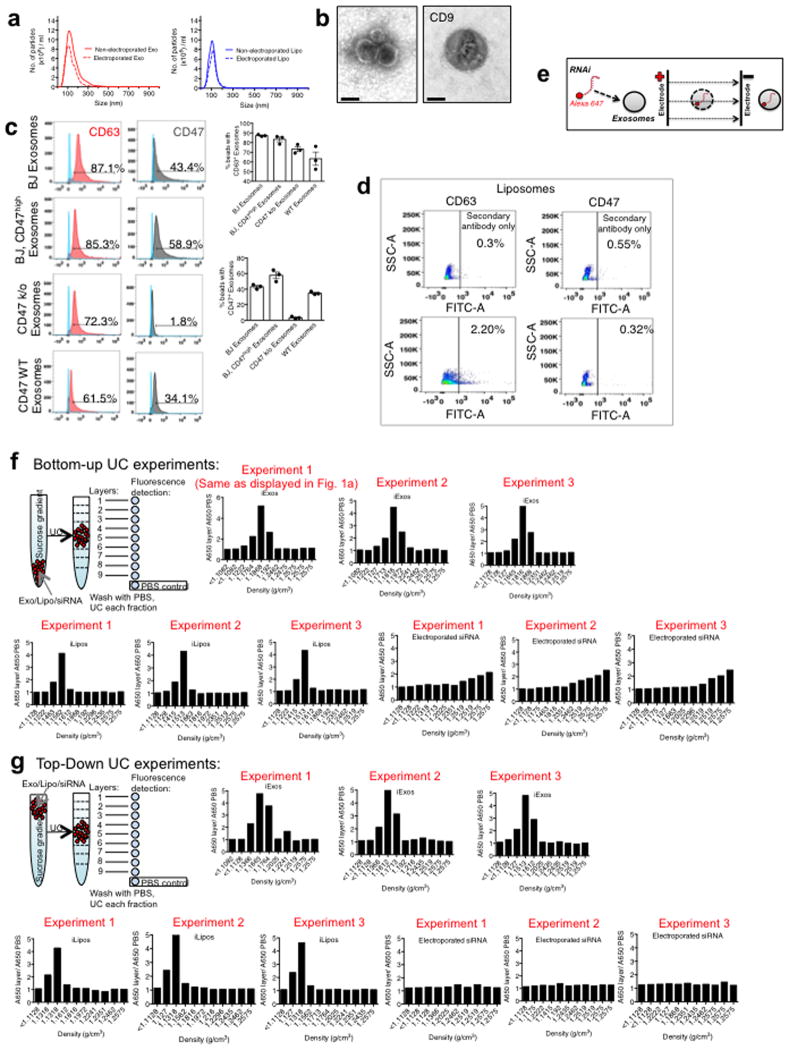
Extended Figure 1. Exosomes purification and siRNA loading.
(A) Exosomes and liposomes numbers and size distribution-using NanoSight™. (B) Transmission electron micrograph of exosomes and stained for CD9 by immunogold (left panel: 2ary antibody only), scale bar: 100nm. (C) FC analyses for CD63 and CD47 on exosomes (n=3 distinct exosomes isolations). (D) FC analyses and quantification of exosomal proteins CD63 and CD47 in liposomes. (E) Schematic representation of electroporation of RNAi into exosomes. (F) Schematic and fluorescence intensity plot of sucrose gradient layers (from the “Bottom-Up” method, UC: ultracentrifuge). Results from three independent experiments are shown. (G) Schematic and fluorescence intensity plot of sucrose gradient layers (from the “Top-Down” method, UC: ultracentrifuge). Results from three independent experiments are shown. The data is presented as the mean ± SEM. FC: Flow cytometry. See accompanying source data.

