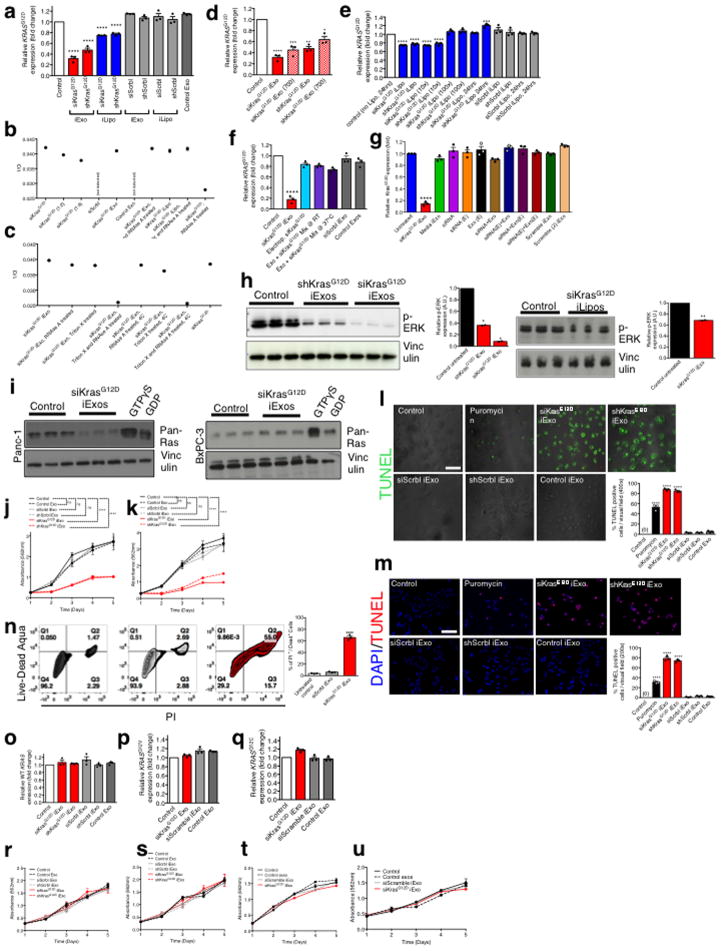
Extended Figure 4. iExosomes specifically target KrasG12D expression.
(A) KRASG12D transcript levels in Panc-1 cells (n=3 independent experiments). (B–C) 1/Ct values from RT-PCR analysis under the listed conditions, to determine the loading efficiency of siRNA. Standards (siKrasG12D, 1:2 and 1:4 dilution): n=1, experimental groups: n=3 independent experiments. (D) KRASG12D transcript levels in Panc-1 cells, n=3 independent experiments. The experiments with 400 exos per cell is the same data that is also presented in panel A. (E–G) KRASG12D transcript levels in Panc-1 cells under the listed conditions. In all groups, n=3 independent experiments. (H) Western blotting (Panc-1 cells) for phosphorylated ERK (p-ERK) and Vinculin. si and sh KrasG12D iExo: One way ANOVA, iLipo: two-tailed t-test, n=2 independent experiments. (I) RAS pull-down assay. (J–K) Panc-1 cells MTT assay (n=5 partitions of indicated treatments with 3 or 6 wells for each partition of treatment) (J) and separate independent experiment (K). (L–M) TUNEL assay (n=3 distinct wells of Panc-1 cells) (L) and separate independent experiment (M). (N) FC analysis of apoptosis in Panc-1 cells. Three different treatments were used to treat n=3 distinct wells of cells. (O) Wild-type KRAS transcript levels in BxPC-3 cells (n=3 independent experiments). (P) KRASG12V transcript levels in Capan-1 cells (n=3 independent experiments) (Q) KRASG12C transcript levels in MIA PaCa-2 cells (n=3 independent experiments). (R–U) MTT assay: n=5 partitions of treatment given to 3 wells each, BxPC-3 cells (R) and separate independent experiment (S), n=3 partitions of treatment given to 10 wells each, Capan1 cells (T), n=3 partitions of treatment given to 10 wells each, MIA PaCa-2 cells, (U). The data is presented as the mean ± SEM. Unless otherwise stated, one-way ANOVA was used to determine statistical significance. * p<0.05, ** p< 0.01, *** p<0.001, **** p<0.0001. FC: Flow cytometry. See accompanying source data. For uncropped blots for H and I, refer to Supplementary Fig. 1.

