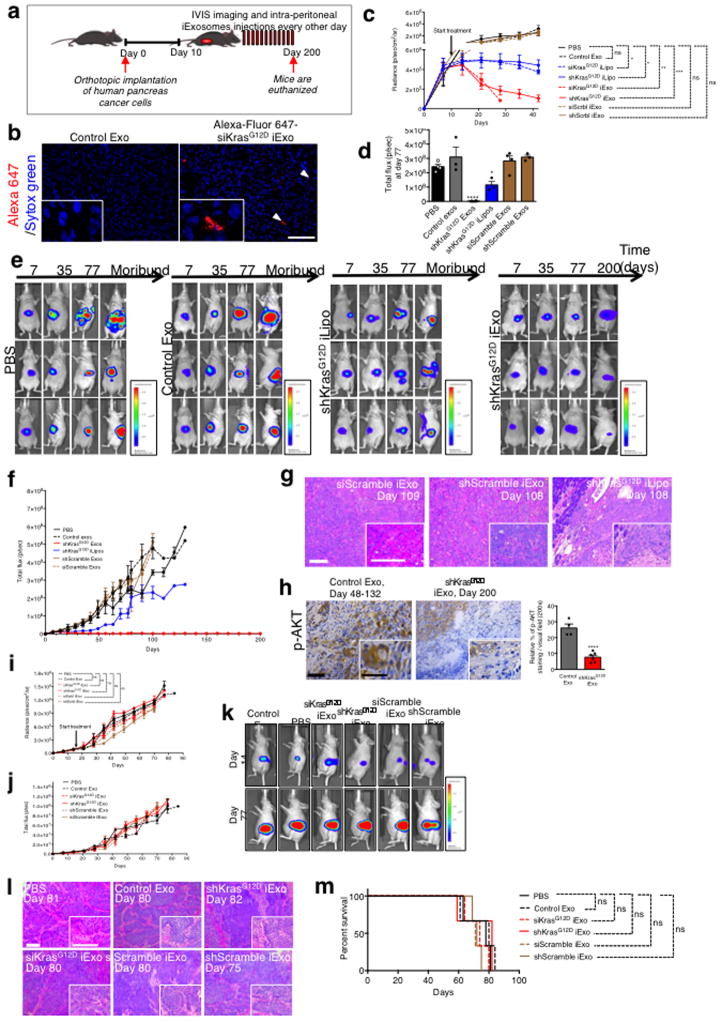
Extended Figure 5. KrasG12D RNAi containing exosomes suppress Panc-1 orthotopic tumor growth but not BxPC-3 orthotopic tumor growth.
(A) Experimental scheme. (B) Representative micrographs (scale bar: 100μm,) depicting accumulation of internalized AF647-tagged siRNA from exosomes. (C) Panc-1 orthotopic tumor growth. PBS: n=6 mice, Control exos: n=6 mice, siKrasG12D iLipo: n=3 mice, shKrasG12D iLipo: n=3 mice, siKrasG12D iExo: n=7 mice, shKrasG12D iExo: n=7 mice, siScrbl iExo: n=5 mice, shScramble iExo: n=5 mice. Statistical test compares treatment groups to PBS control group at day 42-post cancer cell injection, or day 28 for siKrasG12D exos group. Unpaired two-tailed t test. This graph is an inset from the graph shown in Fig. 2C. (D) Tumor bioluminescence at day 77 (total flux), PBS: n=4 mice, Control Exo: n=3 mice, shKrasG12D iExo: n=6 mice, shKrasG12D iLipo: n=3 mice, shScramble iExo: n=3 mice, siScramble iExo: n=4 mice. (E) Luciferase activity at day 7, 35, 77 and moribund stage or day 200 (shKrasG12D iExo)-post cancer cell injection. Some of these panels are also shown in Fig. 2a. (F) Bioluminescence from Panc-1 orthotopic tumors over time (total flux). PBS: n=7 mice, Control Exo: n=6 mice, shKrasG12D iExo: n=7 mice, shKrasG12D iLipo: n=4 mice, shScramble iExo: n=5 mice, siScramble iExo: n=5 mice (G) Representative H&E of the Panc-1 orthotopic pancreas (scale bar: 100μm). (H) Representative micrographs (scale bar: 100μm) of tumors immunolabeled for phosphorylated AKT (p-AKT) and quantification. Control Exo, n=4 mice; shKrasG12D iExo, n=6 mice. Unpaired two-tailed t test. (I–J) BxPC-3 orthotopic tumor growth, n=3 mice per group. (K) Luciferase activity at day 14 and day 77-post cancer cell (BxPC-3) injection. (L) Representative H&E of the BxPC-3 orthotopic pancreas at the indicated experimental endpoints (scale bar: 100μm). (M) Kaplan-Meier curve of BxPC-3 tumor bearing mice, Log-rank Mantel-Cox, n=3 mice per group. The data is presented as the mean ± SEM. Unless otherwise stated, one-way ANOVA was used to determine statistical significance. * p<0.05, ** p< 0.01, *** p<0.001, **** p<0.0001. See accompanying source data.

