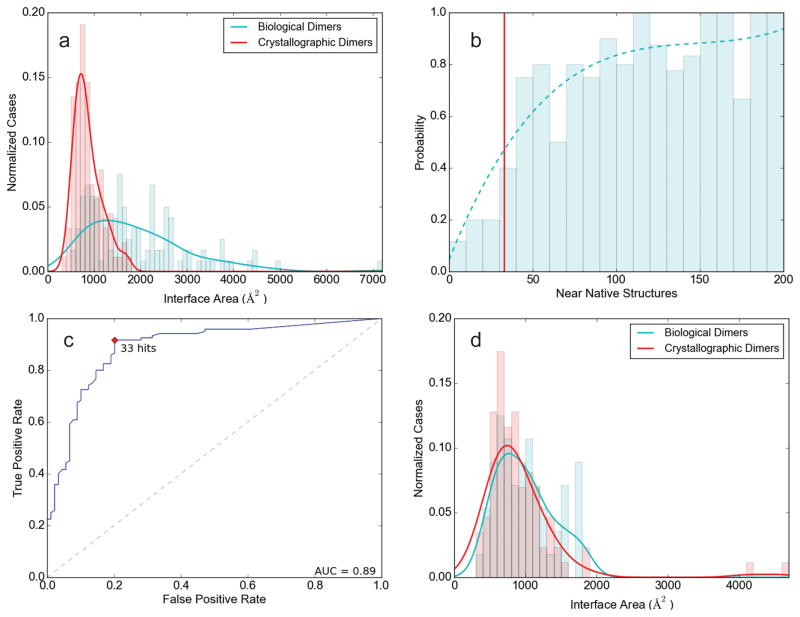
Figure 2.
Selected results for training and “difficult” test sets. (a) Distributions of interface areas for biological dimers (green curve) and crystallographic dimers (red curve) in the training set. (b) Fraction of biological dimers as a function of Nnn, the number of low energy docked structures within 7Å Cα interface RMSD of the native structure. The direct data are shown as bar graph, with the smoothed probability values as the continuous curve. The red vertical line shows the threshold value T = 33 for Nnn. (c) Receiver operating characteristic (ROC) curve for the binary classifier as the value of Nnn is varied. Based on this curve, T = 33 appears to be a reasonable choice for the threshold Nnn value to discriminate between crystallographic and biological dimers. The area-under-the-curve (AUC) value is 0.89. (d) Distributions of interface areas for biological dimers (green curve) and crystallographic dimers (red curve) in the “difficult” subset of the test set.

