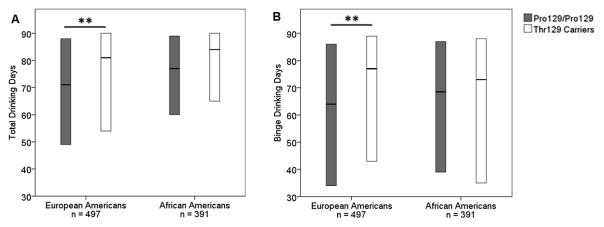
Figure 2.
Boxplots of (A) drinking days and (B) binge drinking days over the past 90 days as assessed by Timeline Followback interview in participants with a diagnosis of alcohol dependence at any assessment. The horizontal line in the middle of each box indicates the median, while the bottom and top borders of the box represent the 25th and 75th percentile values respectively. The distribution of drinking and binge drinking days was significantly different between European American genotype groups. European Americans: Thr129/Thr129 n = 30, Thr129/Pro129 n = 169, Pro129/Pro129 n = 298, African Americans: Thr129/Thr129 n = 56, Thr129/Pro129 n = 185, Pro129/Pro129 n = 150. **p<0.01

