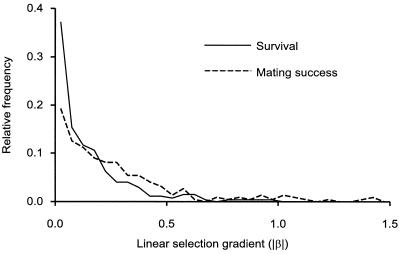
Figure 2.
Frequency distributions showing relative strength of sexual and natural selection. Magnitudes of linear selection gradients were grouped by 0.05 |β| units. Frequency distributions (standardized to account for sample size differences between groups) were significantly different (P < 0.001). More than 33% of studies that used survival as a fitness component reported |β| ≤ 0.05. Median and mean |β| based on measures of survival were 0.153 and 0.088, respectively; median and mean |β| based on mating success were 0.250 and 0.180, respectively.

