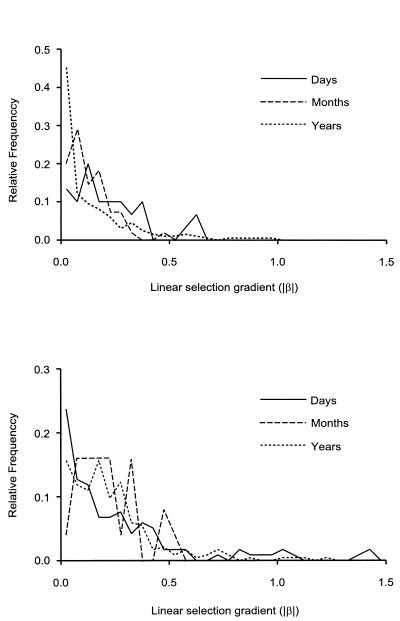
Figure 3.
(a) Frequency distributions of strengths of selection based on survival measured over episode lengths of days (<30 days), months (31–364 days), and years (>365 days). Frequency distributions (standardized to account for sample size differences among groups) of linear selection gradients (|β|) differed significantly (P < 0.002). More than half (54%) of βs measured over a year reported |β| ≤ 0.1, whereas only 36% of βs measured over days reported |β| ≤ 0.1. (b) Frequency distributions of strengths of selection based on mating success measured over the same episode length categories. Frequency distributions (standardized to account for sample size differences among groups) of linear selection gradients (|β|) were not significantly different (P > 0.75). In both figures, selection gradients were grouped by 0.05 |β| units.

