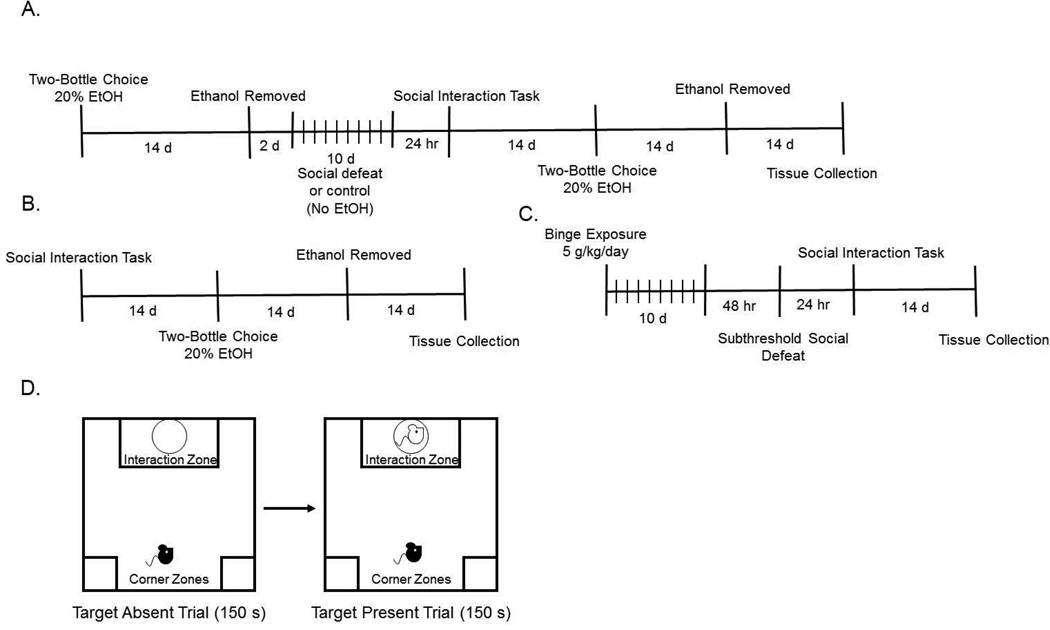
Figure 1. Experimental timeline and diagram for the Social Interaction Task.
(A) Timeline for the first experiment examining the effects of social defeat on social interaction and drinking behaviors (B) Timeline for the second experiment examining how social interaction in stress-naïve mice affects drinking behaviors (C) Timeline for the third experiment examining the effects of prior-exposure to a binge drinking paradigm on susceptibility to a sub-threshold level of social defeat (D) Diagram depicting the protocol of the social interaction task used in all experiments.

