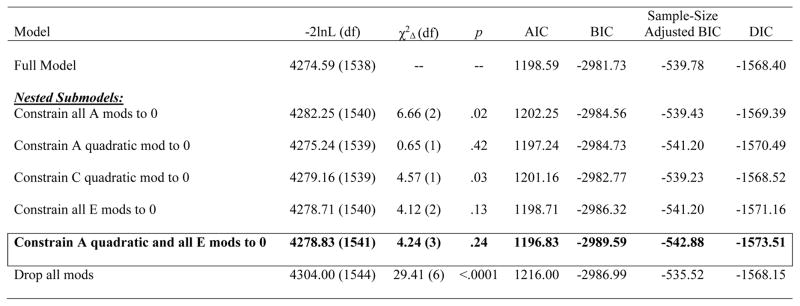
Table 1.
Model Fit Comparisons.
Note. −2lnL = minus twice the log-likelihood; χ2Δ = chi-square change; AIC = Akaike information criterion; BIC = Bayesian information criterion; DIC = deviance information criterion; Full Model = model with paths, linear, and quadratic moderators; A = additive genetic effects; C = shared environmental effects; E = nonshared environmental effects; mod(s) = moderator(s); quadratic = non-linear increases/decreases in effects; Constrain all A mods to 0 = model in which both the linear and quadratic (i.e., nonlinear) additive genetic moderators were constrained to 0; Constrain A quadratic mod to 0 = model in which just the quadratic (i.e., non-linear) additive genetic moderator was constrained to 0; Constrain all C mods to 0 = model in which both the linear and quadratic (i.e., non-linear) shared environmental moderators were constrained to 0; Constrain all E mods to 0 = model in which both the linear and quadratic (i.e., non-linear) nonshared environmental moderators were constrained to 0; Constrain A quadratic and all E mods to 0 = model in which the quadratic (i.e., non-linear) additive genetic moderator and all of the nonshared environmental moderators (i.e., linear and quadratic) were constrained to 0; Drop all mods = model in which the linear and quadratic moderators for additive genetic, shared environmental, and nonshared environmental influences were constrained to 0. Each nested submodel is compared to the full model when calculating the χ2Δ and degrees of freedom. The best-fitting model, as determined by a non-significant chi-square change test and the lowest AIC, BIC, sample-adjusted BIC, and DIC values, is noted by cell borders and bolded text. Unstandardized estimates (95% confidence intervals) from the best-fitting model is included here, with significant effects noted in bolded text: additive genetic path (a) = −.17 (−.49, .36), shared environment path (c) = .06 (−.28, .31), nonshared environment path (e) = −.76 (−.81, −.72), linear genetic moderator (βX) = 1.39 (.47, 1.98), linear shared environment moderator (βY) = 4.09 (2.06, 5.92), linear nonshared environment moderator (βZ) = 0, quadratic genetic moderator (βX2) = 0, quadratic shared environment moderator (βY2) = −6.67 (−9.84, −3.45), quadratic nonshared environment moderator (βZ2) = 0.

