
Figure 3.
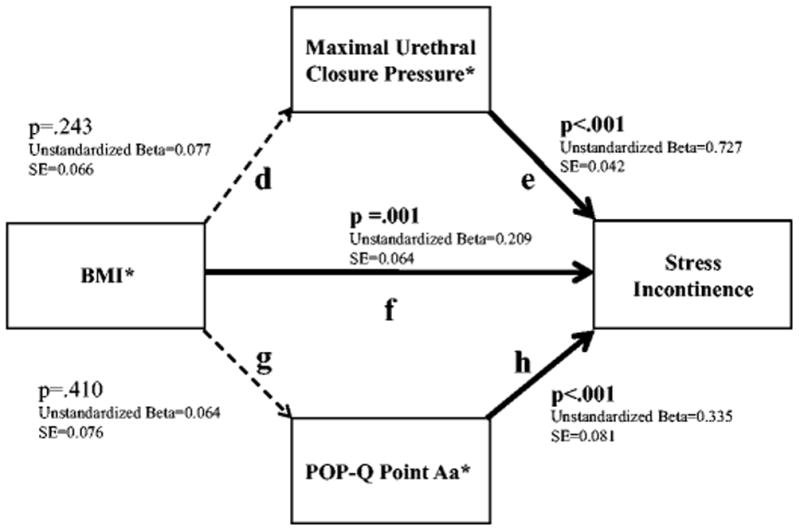
Structural Equation Modeling Showing the Relationships Between BMI and Measures of Urethral Function, Urethrovaginal Support, and Stress Urinary Incontinence. *Standardized values used for analyses
Direct, Indirect and Total Effects:
Direct effect of BMI on Stress Incontinence (f)=0.209 (SE=0.064), p=.001
Indirect effect of BMI on Stress Incontinence through Maximal Urethral Closure Pressure (d & e)=0.056 (SE=0.048), p=.243 Indirect effect of BMI on Stress Incontinence through POP-Q Point Aa (f & h)=0.021 (SE=0.026), p=.410
Total effect of BMI on Stress Incontinence (d & e & g & h & f)=0.286 (SE=0.091), p=.002
Fit Indices:
Chi(1)=0.012, p=0.913; RMSEA <.001 (90% CI: <.001, .073); CFI 1.000