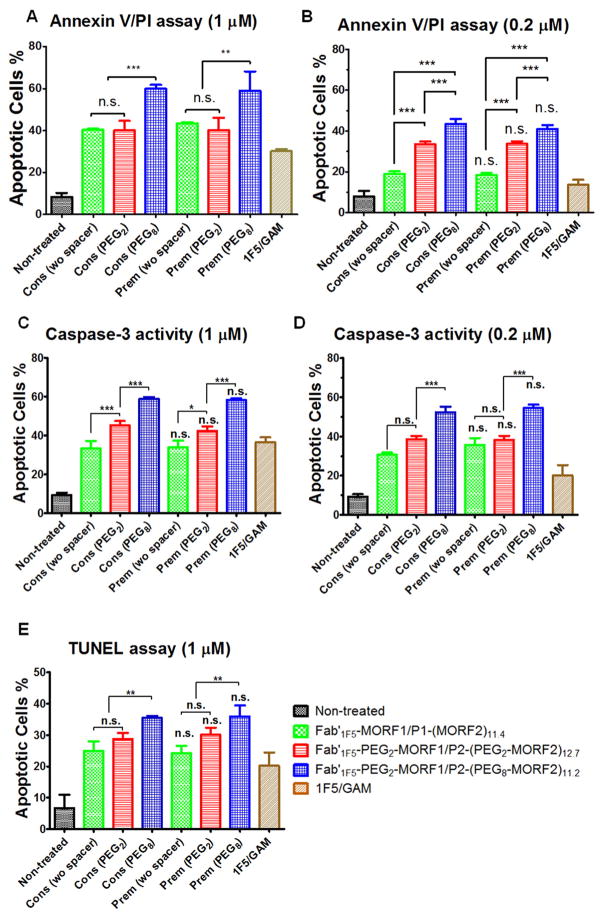
Fig. 6.
Effect of spacer length on apoptosis induction of Raji B-cells analyzed by different assays. (A, B) Annexin V/PI binding assay. (C, D) Caspase-3 activation assay. (E) TUNEL assay. Incubation time was 24 h. For figures A, B, C, and D, 2 × 10⁵ cells were used for each test. For figure E, 1 × 10⁶ cells were used. Non-treated, cells in culture medium; Cons, Consecutive exposure, Fab′1F5-MORF1 or Fab′1F5-PEG2-MORF1 (0.2 μM or 1 μM) followed (1 h later) by P1-(MORF2)11.4, P2-(PEG2-MORF2)12.7 or P2-(PEG8-MORF2)11.2 (0.2 μM or 1 μM, MORF2-eqv); Prem, Cells were exposed to the premixture of Fab′1F5-MORF1 or Fab′1F5-PEG2-MORF1 (0.2 μM or 1 μM) and P1-(MORF2)11.4, P2-(PEG2-MORF2)12.7 or P2-(PEG8-MORF2)11.2 (0.2 μM or 1 μM, MORF2-eqv); 1F5/GAM, 1F5 mAb (1 μM) followed (1 h later) by goat anti-mouse secondary Ab (0.5 μM). Percentage of apoptotic cells was quantified by flow cytometry. Statistics, unless otherwise indicated, was performed by comparing each premixed treatment with the corresponding consecutive treatment (***p < 0.0001, n.s.: no significant difference). All data are presented as mean ± SD (n = 3). Statistical analyses were performed by Student’s t-test to compare between two groups, or one-way analysis of variance (ANOVA) to compare three or more groups (with p value < 0.05 indicating statistically significant difference). (wo spacer): Fab′1F5-MORF1 with P1-(MORF2)11.4; (PEG2): Fab′1F5-PEG2-MORF1 with P2-(PEG2-MORF2)12.7; (PEG8): Fab′1F5-PEG2-MORF1 with P2-(PEG8-MORF2)11.2.

