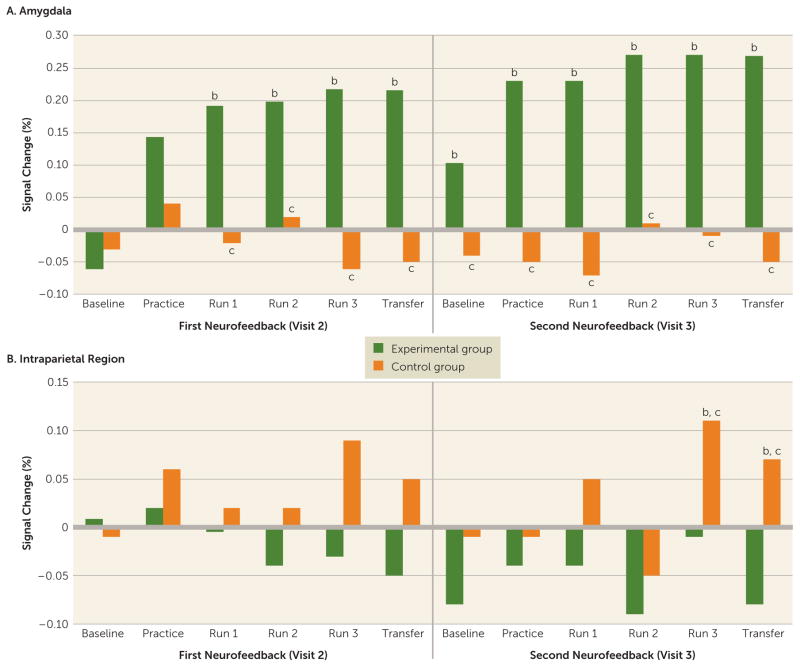
FIGURE 1. Regional Percent Signal Change for Each Region of Interest, Run, and Group in a Trial of Real-Time fMRI Amygdala Neurofeedback for Major Depressive Disordera.
aIn each group, the average percent signal change for the happy-rest condition for each run in the left amygdala (panel A) and in the left horizontal segment of the intraparietal sulcus (panel B). b Significant difference from the initial pre-neurofeedback baseline run, p<0.05. c Significant difference from the corresponding run in the experimental group, p<0.05.

