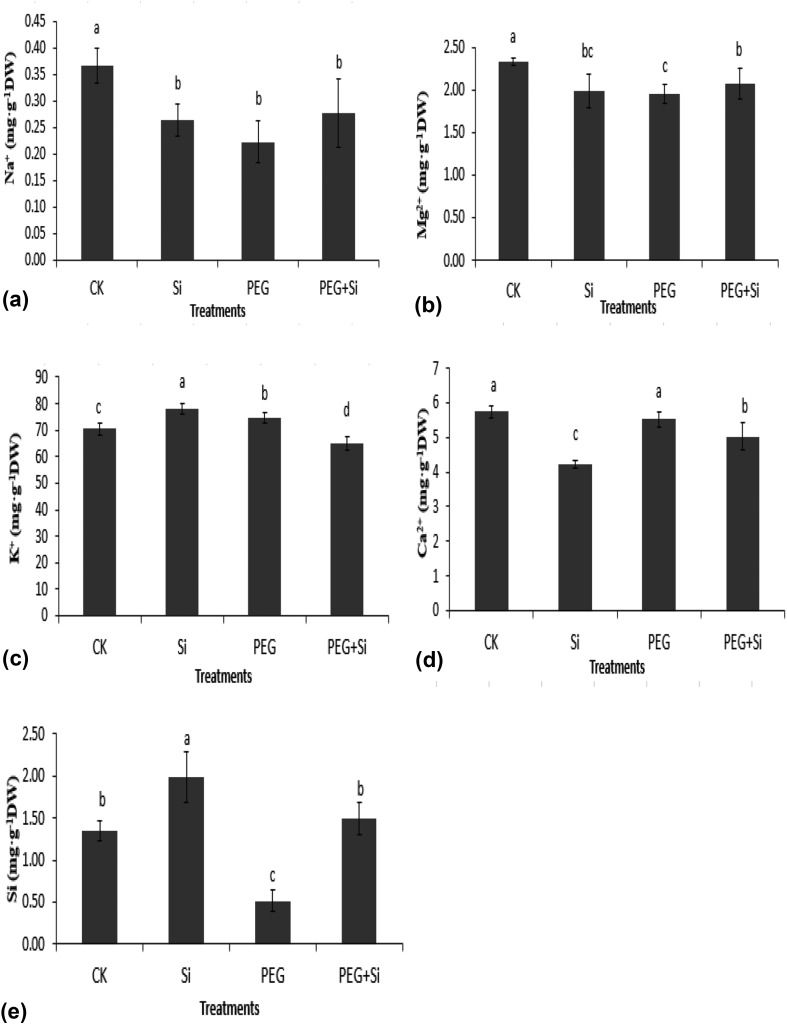
Fig. 1.
Effect of different silicon (1.0 mM) and PEG-6000 (20%) treatments on Na (a), Mg (b), K (c), Ca (d) and Si (e) contents in wheat seedlings (Triticum aestivum L. cv. Longchun 8139). Values are means of three replicates ±SD. Columns marked with the same small letters are not significantly different according to the LSD test at P ≤ 0.05

