
Fig. 3.
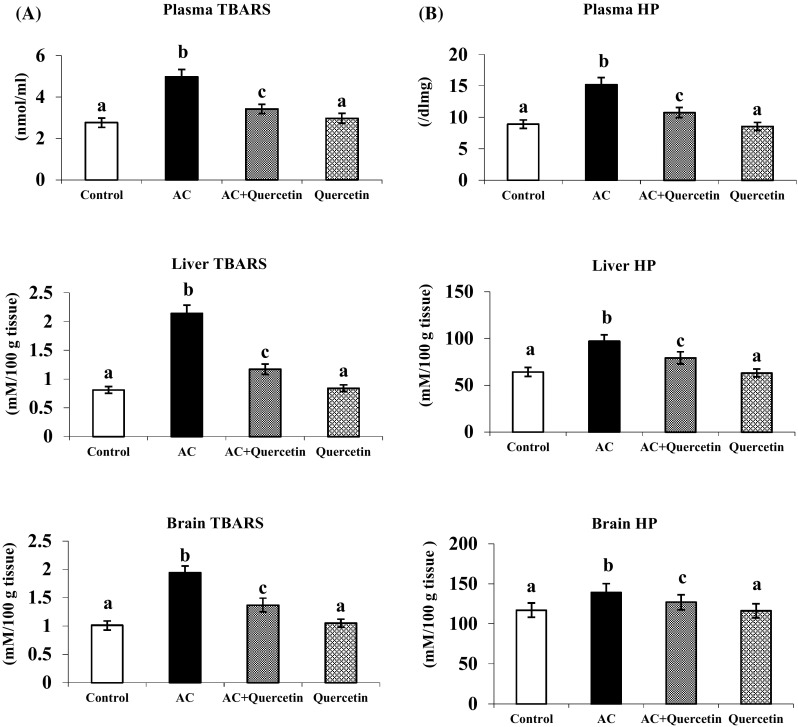
Effect of quercetin on the levels of TBARS and HP in plasma, liver and brain in normal and experimental rats. a Plasma TBARS. b HP in liver and brain. Each value is mean ± SD for six rats in each group, columns not sharing a common superscript letter differs significantly with each other (p < 0.05, Duncan’s multiple range test)