
Fig. 4.
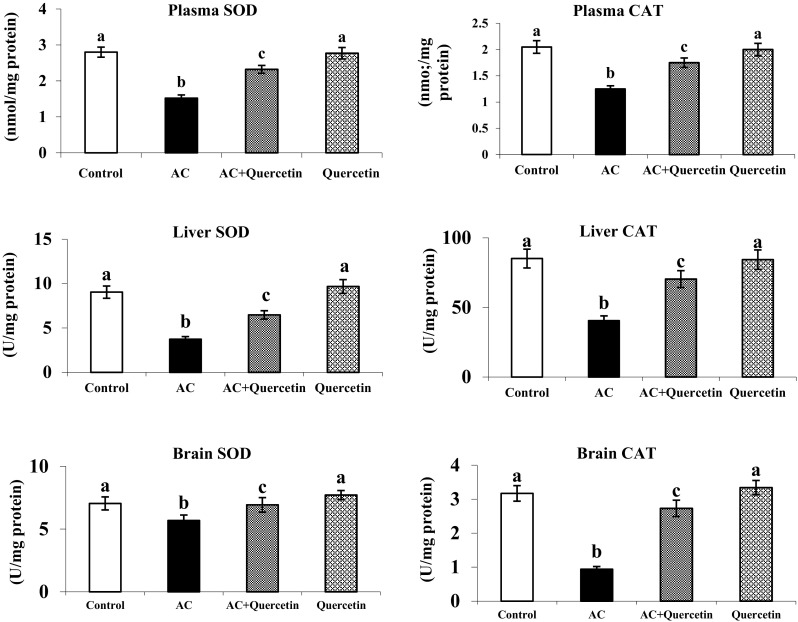
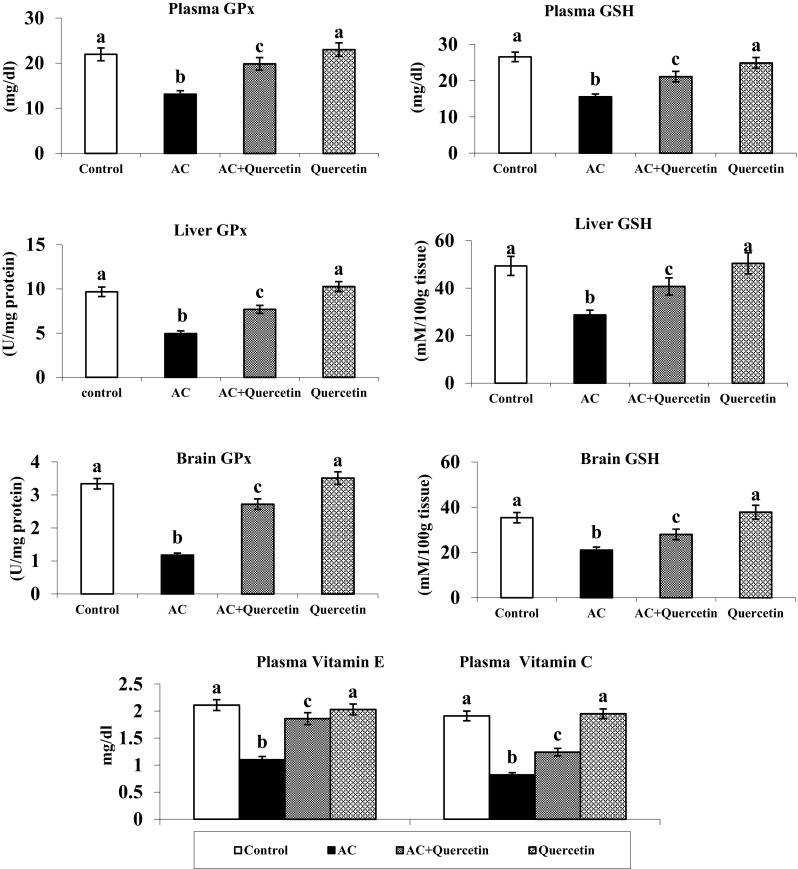
Changes in the activities of SOD, CAT and the levels of GPX in plasma, liver and brain of normal and experimental rats Effect of quercetin on the levels of GSH in plasma, liver and brain Figure legends and vitamins E and C in plasma (mean ± SD).Values not sharing a common superscript letter differ significantly (p < 0.05). UA—one unit of activity was taken as the enzyme reaction, which gave 50 % inhibition of NBT reduction in 1 min. UB—μmol of hydrogen peroxide consumed/minute. UC—μg of glutathione consumed/minute