Figure 2.

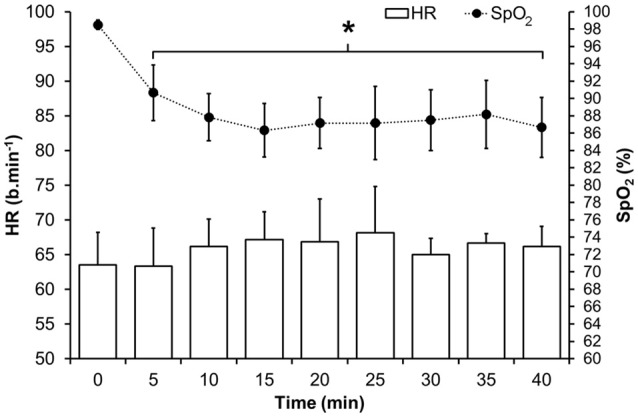
Mean (SD) HR and oxyhaemoglobin saturation during the hypoxic intervention in HPCI. *Indicates significant difference (p < 0.05) vs. baseline values.

Mean (SD) HR and oxyhaemoglobin saturation during the hypoxic intervention in HPCI. *Indicates significant difference (p < 0.05) vs. baseline values.