FIGURE 4.

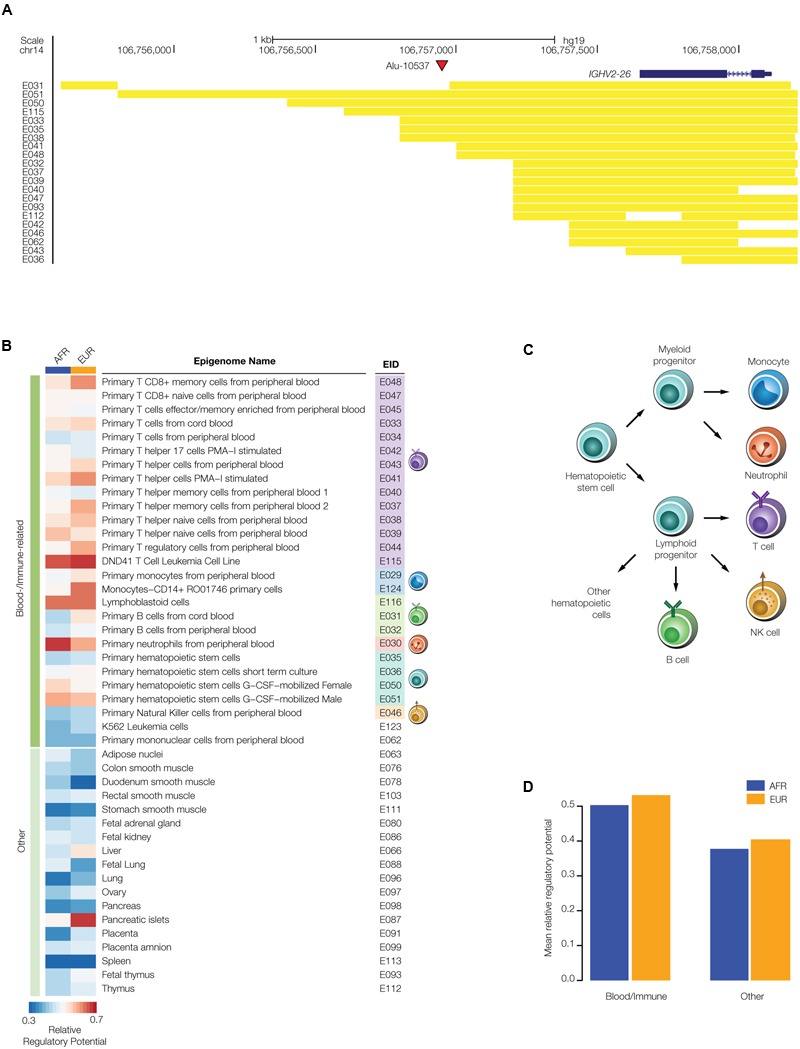
Regulatory potential of disease-linked polyTE insertions. PolyTE insertions linked to disease-associated SNPs were evaluated for their co-location with tissue-specific enhancers. (A) UCSC Genome Browser screen capture showing an example of a polyTE insertion – Alu-10537 – that overlaps with a number of tissue specific enhancers. The genomic location of the Alu insertion on chromosome 14, downstream of the IGHV2-26 gene (blue gene model), is indicated with a red arrow. The genomic locations of co-located enhancers, characterized based on chromatin signatures from a variety of tissue-specific epigenomes, are indicated with yellow bars. (B) Heatmap showing the relative regulatory potential (see Materials and Methods section Evaluating polyTE Regulatory Potential) of polyTE insertions for a variety of tissue-specific epigenomes. Blood- and immune-related tissues are shown separately from examples of the other tissue types analyzed here. (C) Developmental lineage of immune-related cells for which enhancer genomic locations were characterized. (D) The mean relative regulatory potential for disease-linked polyTE insertions is shown for blood- and immune-related tissues compared to all other tissue-types analyzed here. Values for the African (AFR – blue) and European (EUR – orange) population groups are shown separately.
