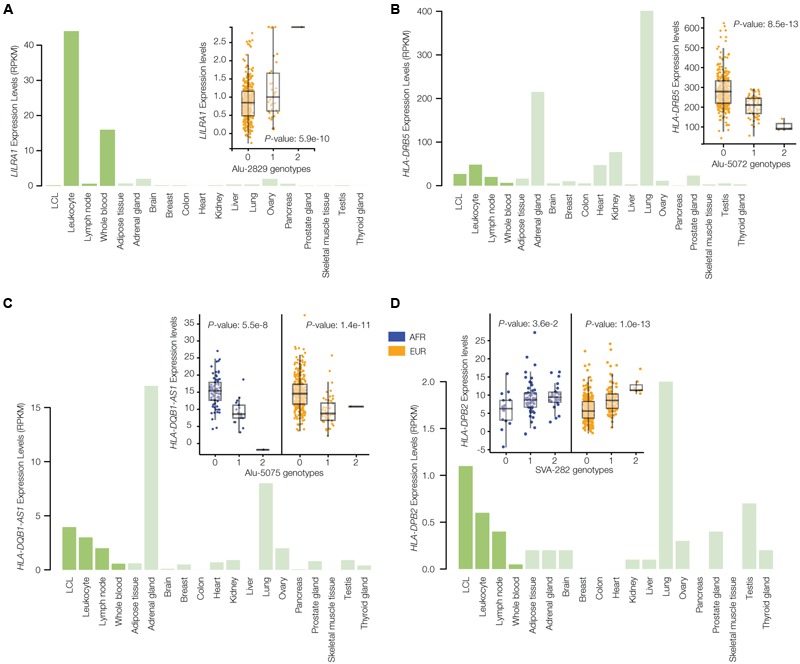
FIGURE 6.

Gene expression profiles and eQTL results for disease-associated polyTE insertions. Bar-charts of tissue-specific expression levels and box-pots of eQTL analyses are shown for four examples of TE-eQTLs corresponding to disease-linked and enhancer co-located polyTE insertions that regulate immune-related genes: (A) Alu-2829 and LILRA1, (B) Alu-5072 and HLA-DRB5, (C) Alu-5075 and HLA-DQB1-AS1, and (D) SVA-282 and HLA-DPB2. Bar-charts show tissue-specific expression levels as normalized RPKM values (green). The inset eQTL box-plots show individual sample gene expression levels (y-axis) regressed against polyTE insertion presence/absence genotypes (x-axis): 0-homozygous absent, 1-heterozygous, 2-homozygous present. Each dot represents a single individual from the African (AFR – blue) and/or European (EUR – orange) population groups.
