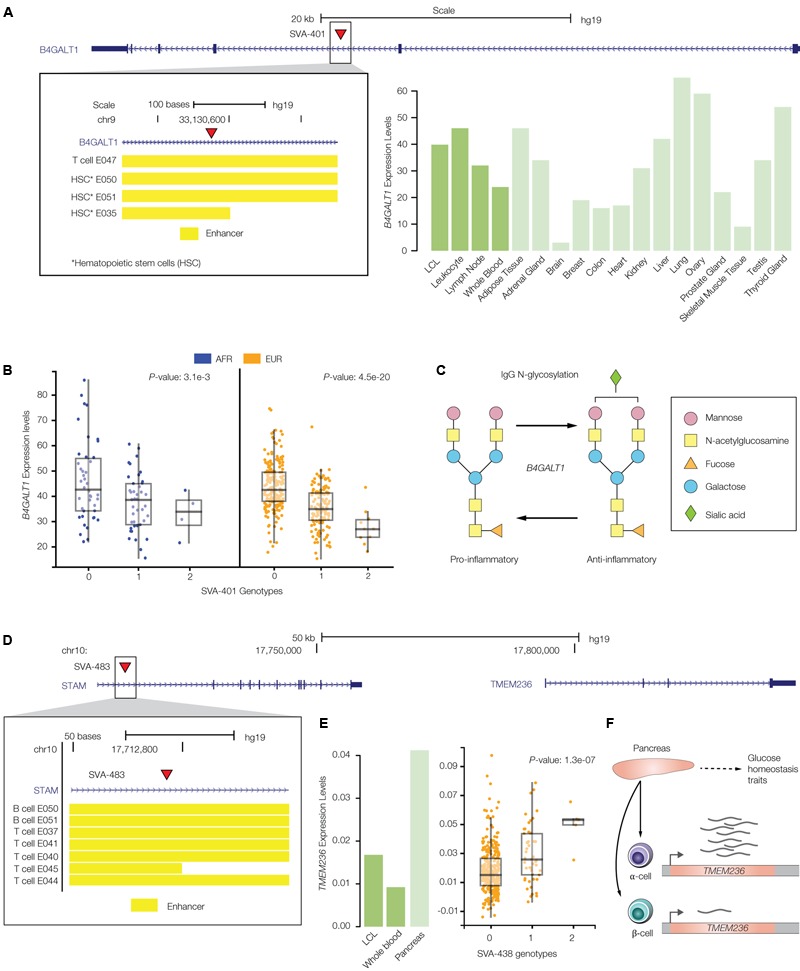
FIGURE 7.

PolyTE insertions associated with immune- and blood-related conditions. (A) UCSC Genome Browser screen capture showing the location of the SVA-401 insertion (red arrow) on chromosome 19 within the second exon of the B4GALT1 gene. The inset shows the genomic locations of co-located enhancers, characterized based on chromatin signatures from a variety of tissue-specific epigenomes locations, as yellow bars. The bar-chart shows B4GALT1 tissue-specific expression levels as normalized RPKM values (green). (B) eQTL box-plots show individual sample gene expression levels (y-axis) regressed against SVA-401 insertion presence/absence genotypes (x-axis): 0-homozygous absent, 1-heterozygous, 2-homozygous present. Each dot represents a single individual from the African (AFR – blue) or European (EUR – orange) population groups. (C) B4GALT1 catalyzed glycosylation of the Immunoglobulin G (IgG) antibody, resulting in conversion from pro- to anti-inflammatory activity. (D) UCSC Genome Browser screen capture showing the location of the SVA-438 insertion (red arrow) on chromosome 10 within the first exon of the STAM gene, upstream of the regulated TMEM236 gene. The inset shows the genomic locations of co-located enhancers (yellow bars). (E) Bar-chart of TMEM236 tissue-specific expression levels and box-pot of the SVA-438 TMEM236 eQTL analyses. (F) Functional role and cell-type specific expression profile for TMEM236.
