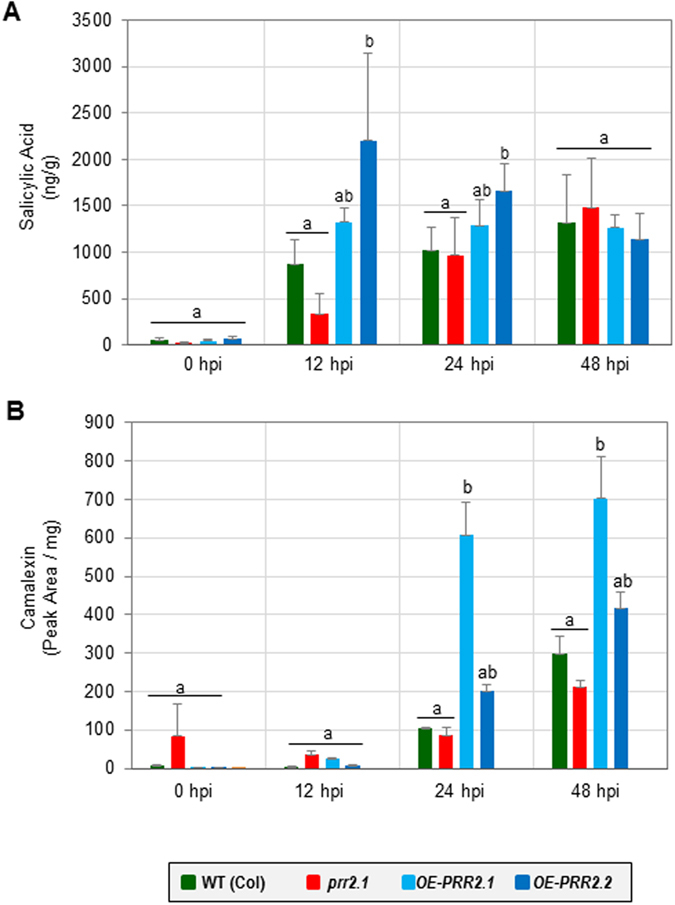
Figure 5.

Quantification of total SA and camalexin content in prr2 genotypes in response to Pseudomonas syringae inoculation. (A) Quantification of SA levels in leaves of 4-week-old plants of Arabidopsis thaliana in control conditions or after inoculation with Pst DC3000. SA quantifications were performed at 0 h, 12 h, 24 h and 48 h post-inoculation in WT (Col) and prr2 plants (prr2.1, OE-PRR2.1 and OE-PRR2.2) with Pst DC3000 at 107 cfu.mL−1. (B) Quantification of camalexin levels in leaves of 4-week-old plants of Arabidopsis thaliana in control conditions or after inoculation with Pst DC3000. Camalexin content was measured in WT, prr2 and OE-PRR2 lines after inoculation with Pst DC3000. For A and B, each bar represents the mean and standard error of three biological replicates. Bars sharing the same letter are not significantly different according to Dunnett’s test (p-value < 0.05).
